
Overview
The Consumption KPI Dashboard displays a variety of consumption-related data, including:
-
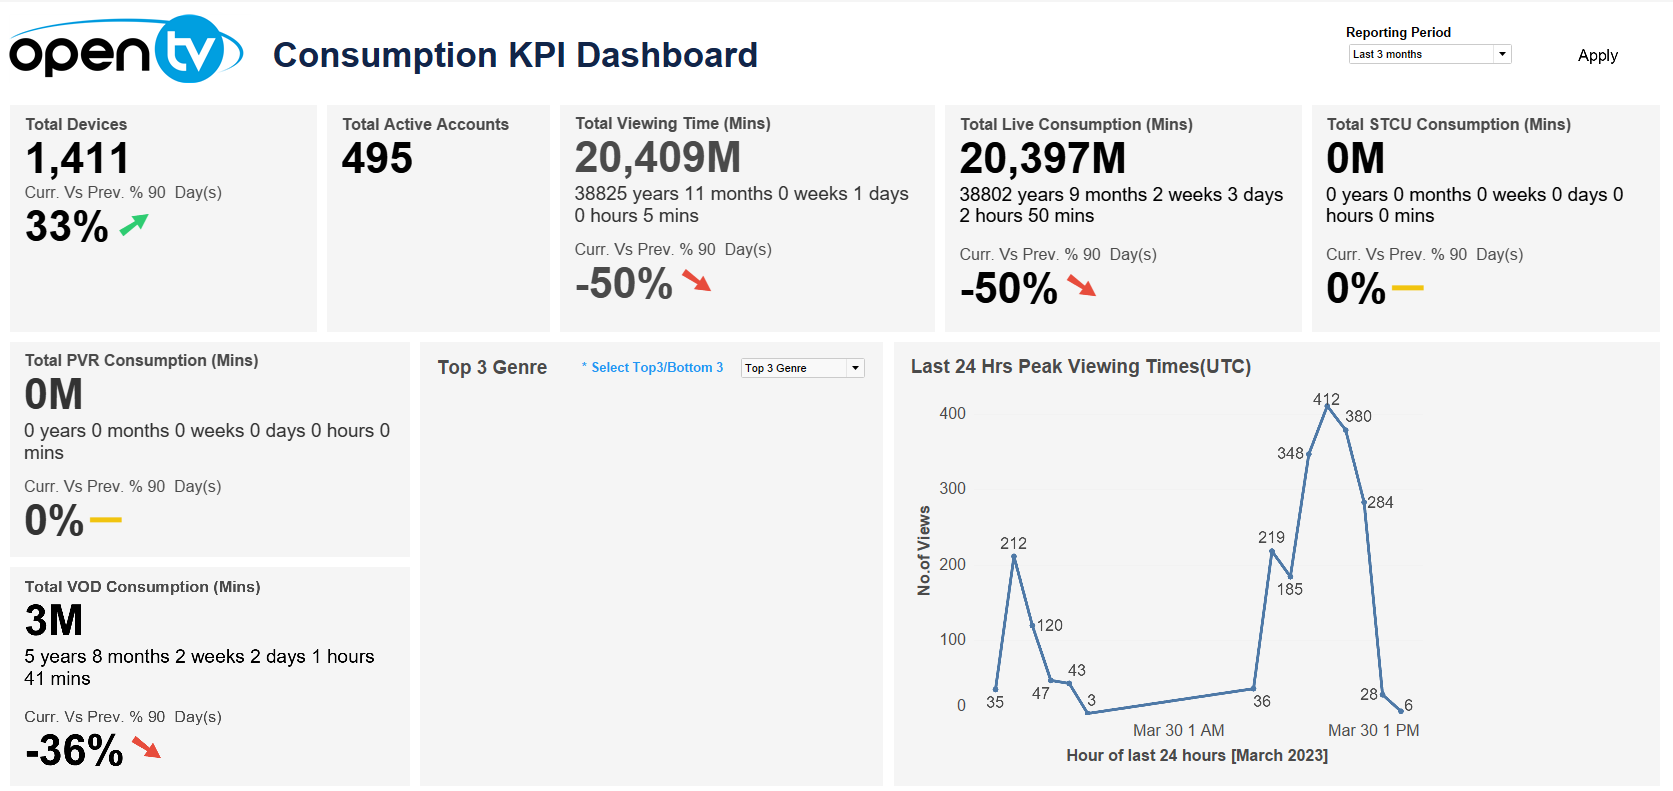
Total number of devices and change from previous period
-
Total number of active accounts
-
Total viewing time in minutes and change from previous period
-
Total STCU consumption in minutes and change from previous period
-
Total PVR consumption in minutes and change from previous period
-
Total VOD consumption in minutes and change from previous period
-
The top/bottom three genres shows the most or least popular genres by number of views
(Click Select Top 3/Bottom 3 to toggle between top three and bottom three.) -
The peak viewing times for the last 24 hours
Note that the date/time selection does not apply to this tile.
Hovering over the lower part of the tile shows + and - buttons that allow you to expand/contract the date range.
-
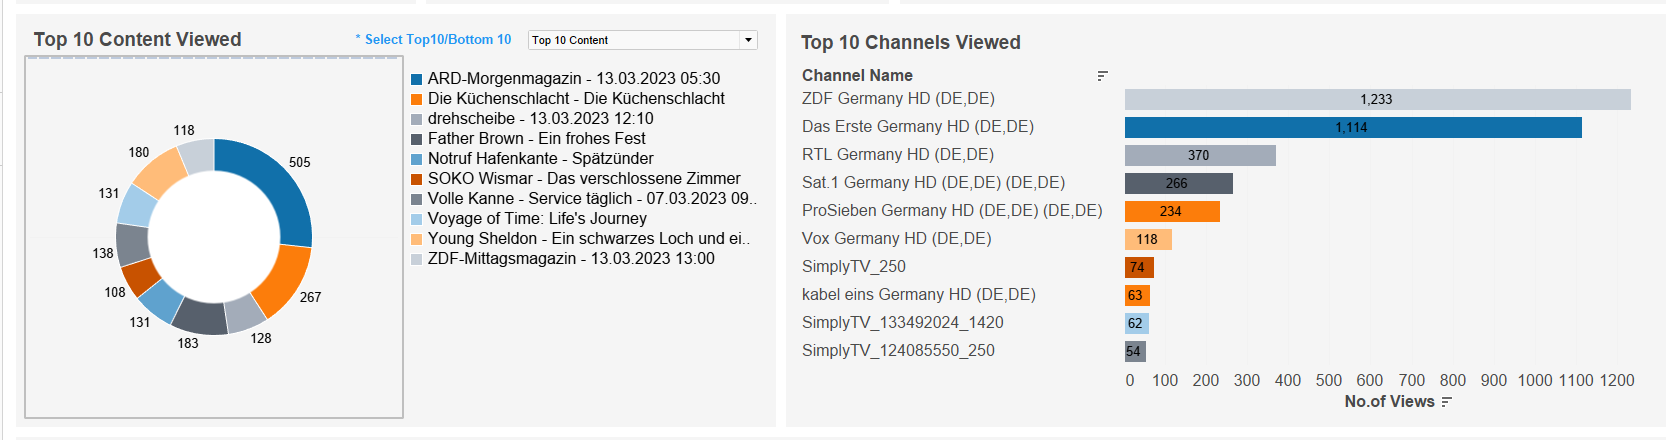
Top/bottom 10 most/least viewed content
(Click Select Top 10/Bottom 10 to toggle between top three and bottom three.) -
Top 10 most viewed channels
-
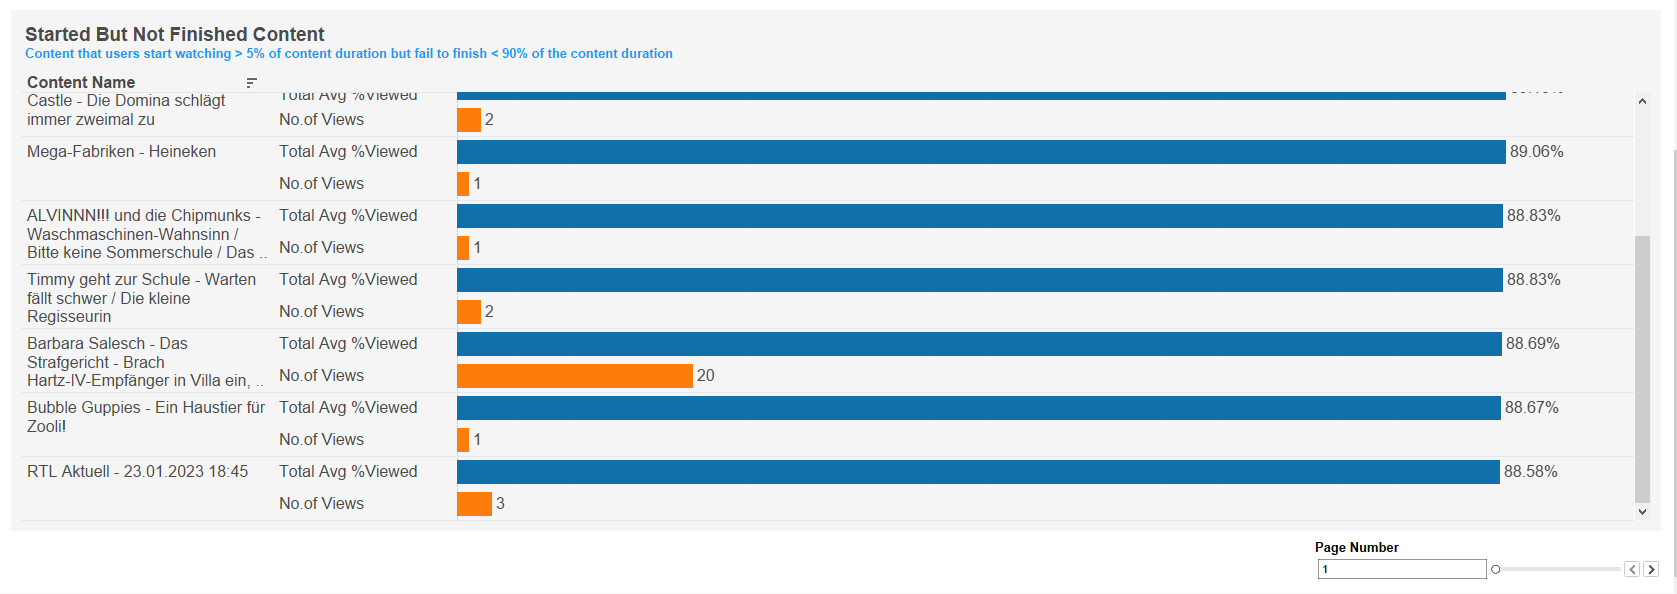
Chart of content that was not viewed until the end, ordered by average percentage viewed in descending order
Note that this shows the top 10 contents and has a pagination control for displaying subsequent pages.
At the top of the page, you can:
-
Change the date range.
In each tile, you can:
-
Hover over or click the data or chart to see additional information.
-
Click and continue hovering over the tile, then click

In this window, you can:See more detailed data, including (for some categories) a list of the accounts that comprise the total shown in the tile.Change the sort order.Show and hide fields.Change the number of rows displayed.Download the data.