This page provides networking Quality of Service metrics and analytics. Data on this page is also displayed on the Overview page.

Networking
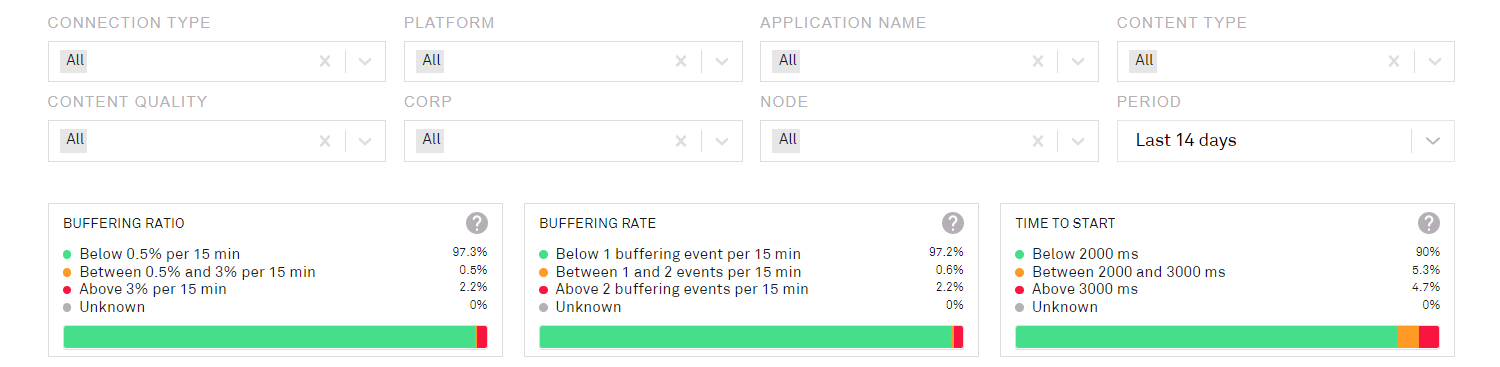
The top of the page displays the networking data. For a description of these metrics, click the 
Users can filter the results by:
-
Connection type
-
Platform
-
Application
-
Content type
-
Content quality
-
Corp
-
Node
-
Period
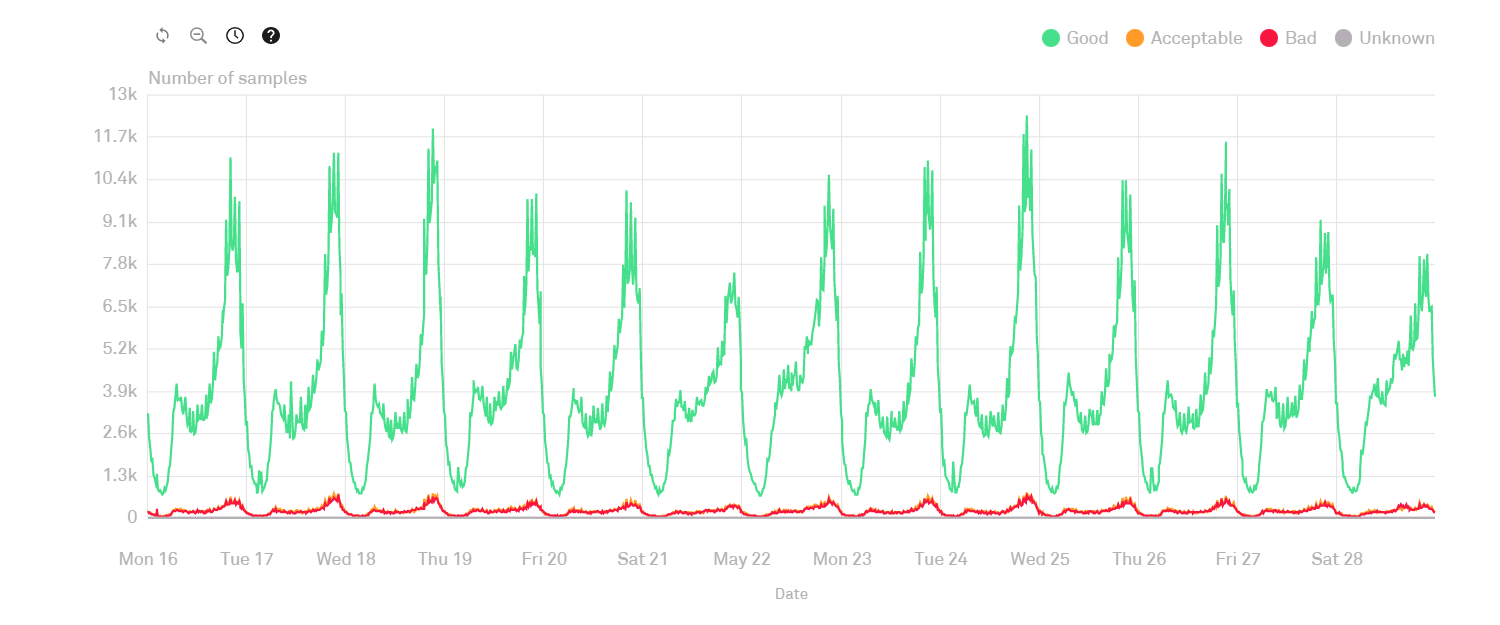
Buffering Ratio
This chart provides a graphical representation of the buffering ratio details above.
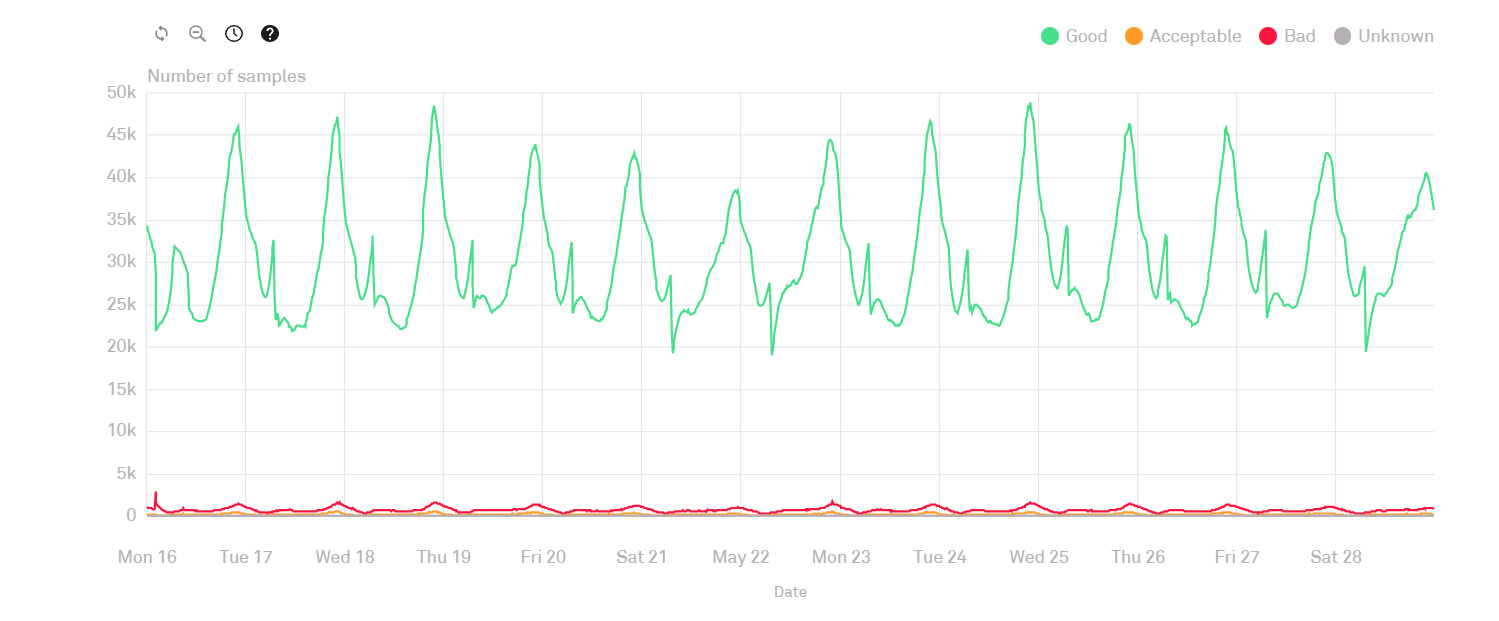
Buffering Events Frequency
This chart provides a graphical representation of the buffering rate details above.
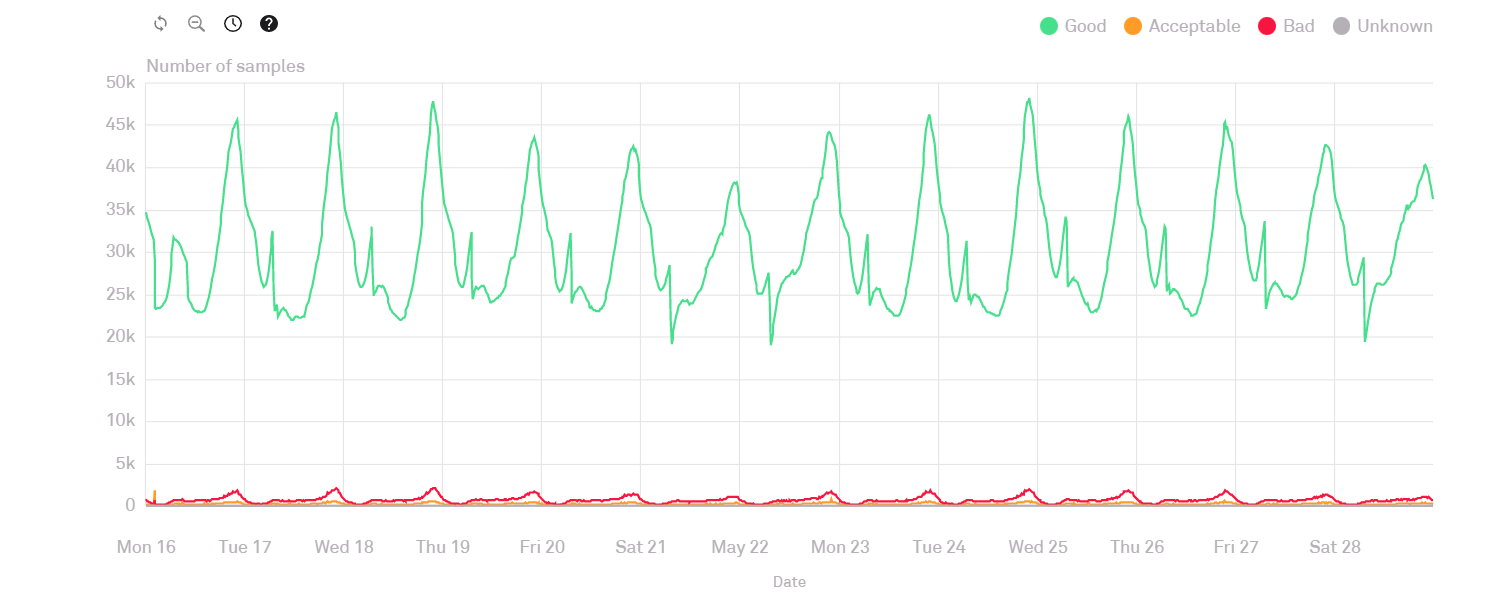
Time To Start
This chart provides a graphical representation of the time-to-start details above.