Clicking a row on the VOD content items or Top 5 tables displays the detailed information for that item.

Summary
The top of the page displays a summary of the data.

Performance
The default view shows the performance of the VOD item across all platforms. For a description of these metrics, click the 
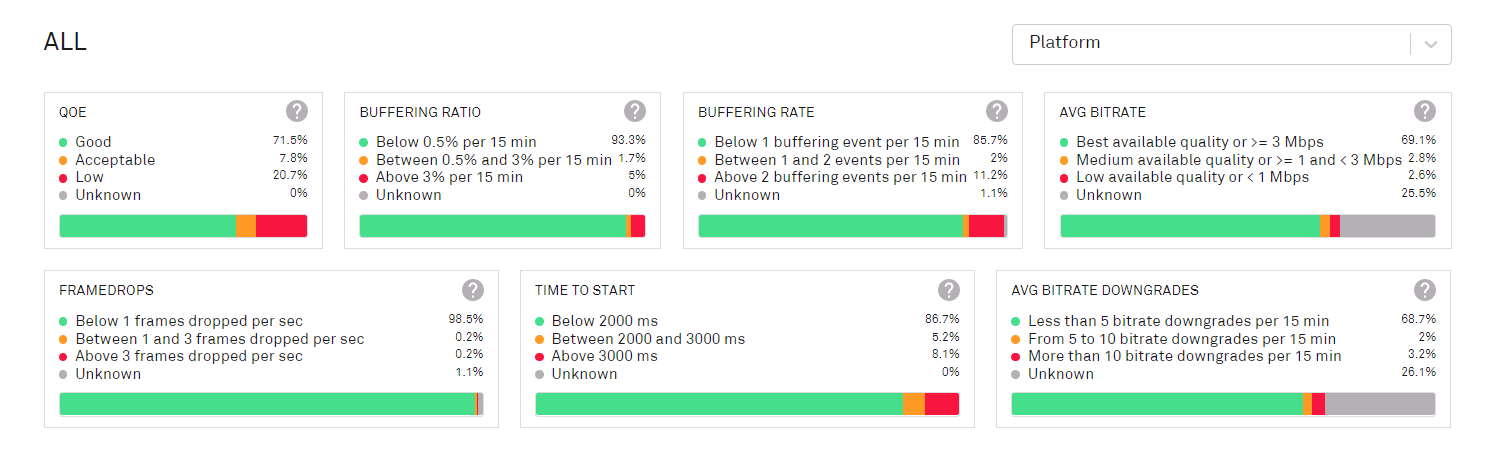
The data can be broken down by individual platform; more than one platform can be selected.
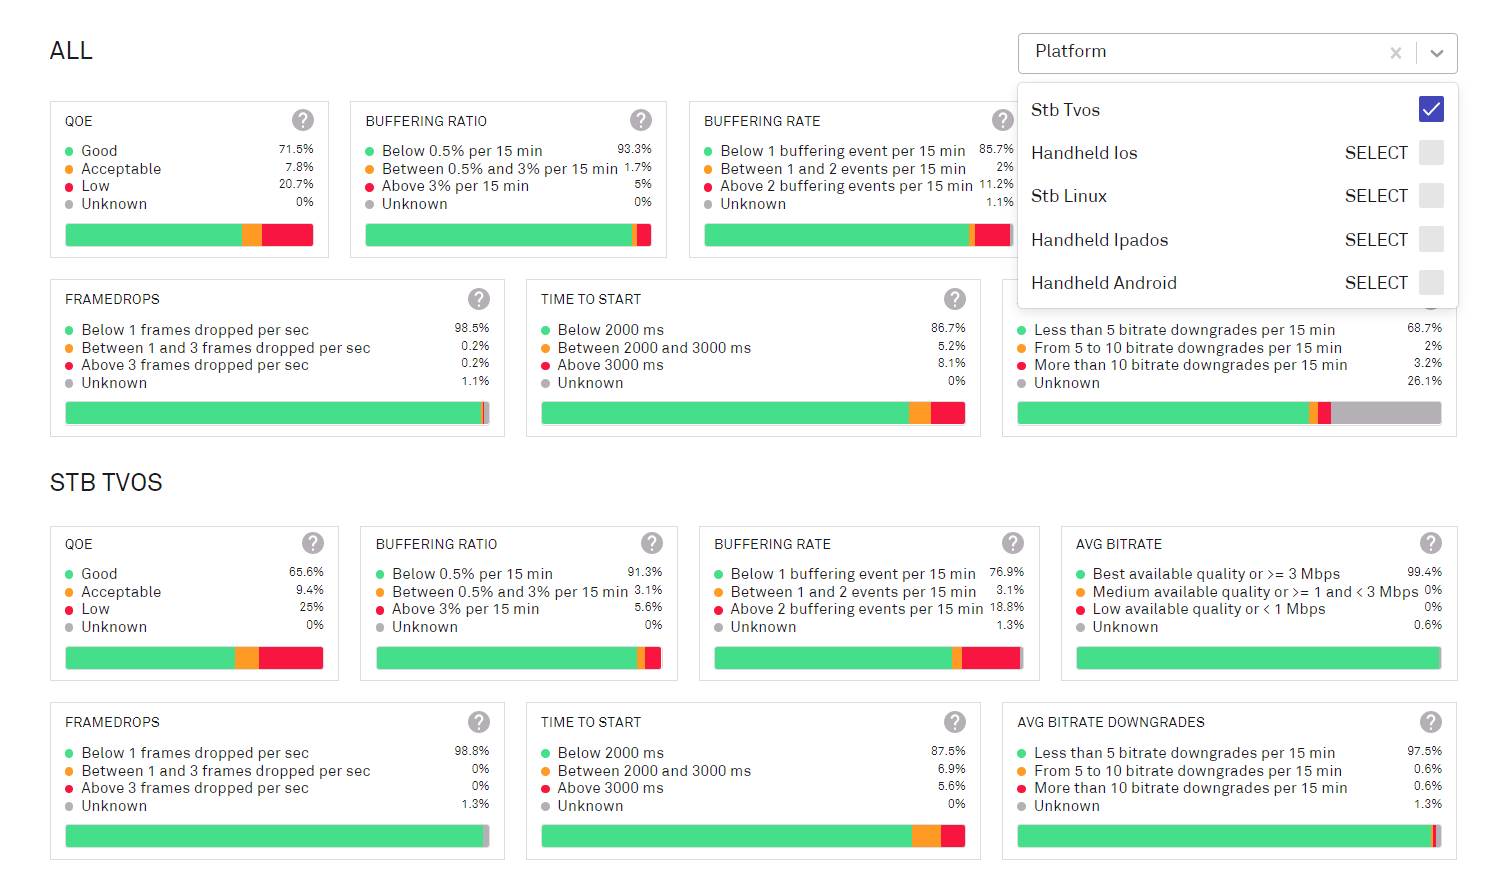
When platforms are selected, the Content Performance, Daypart and Completion Rate details are removed from the page.
Content Performance
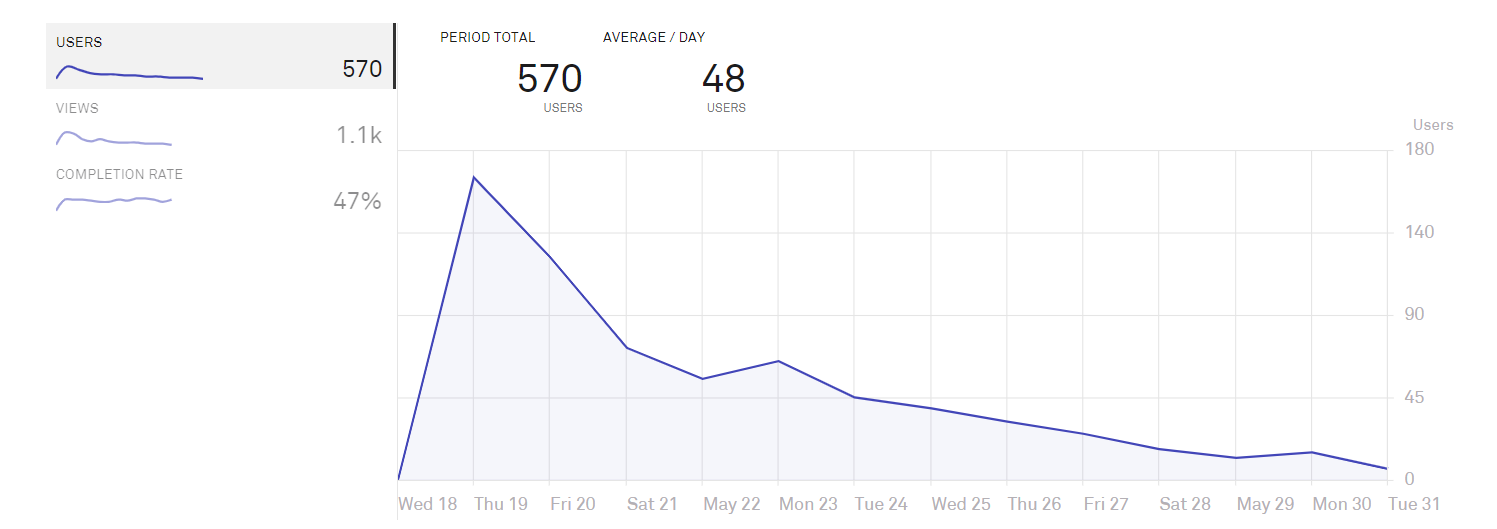
These charts show TV performance broken down by users, views and completion rate.
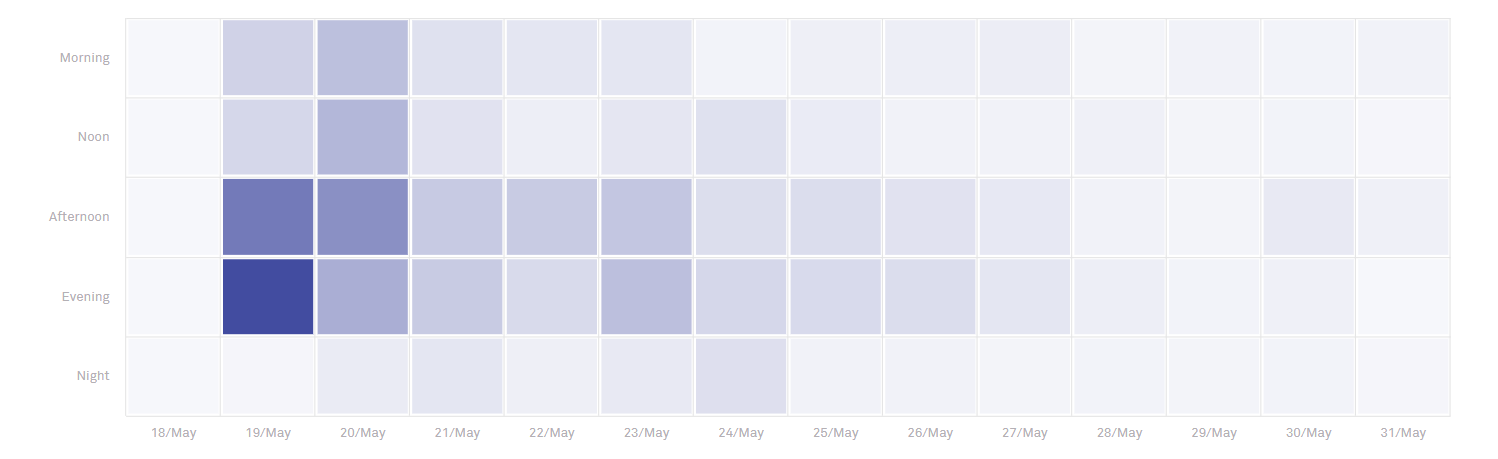
Daypart
This chart shows the number of viewers of the program at different times of the day.
Completion rate
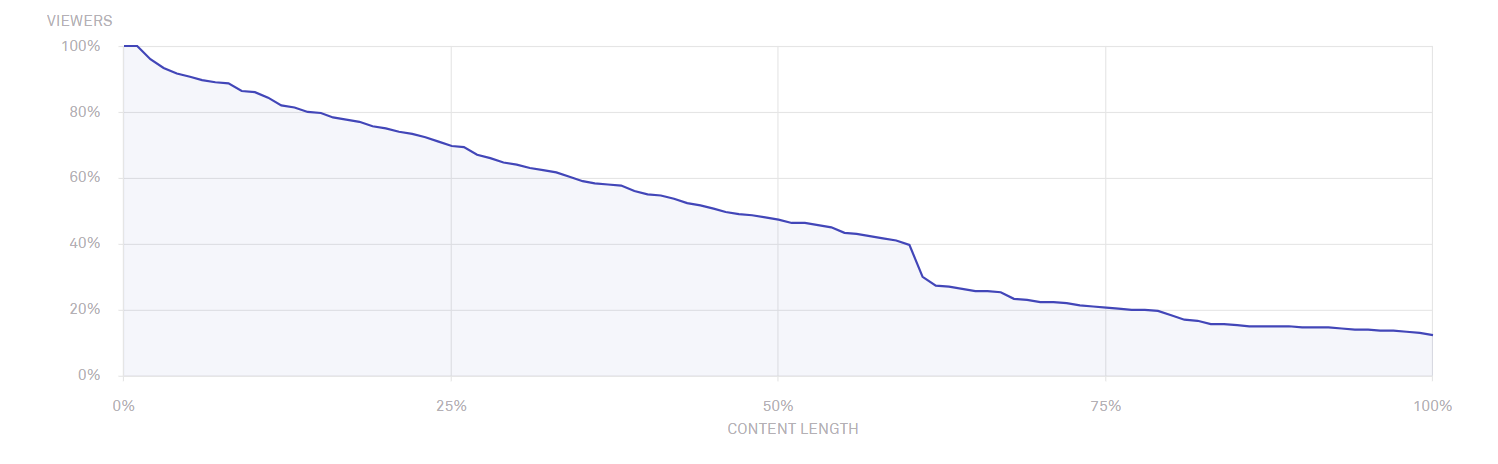
This chart shows the number of viewers who finish watching the program.