The first page provides an overview of Quality of Service metrics and analytics.

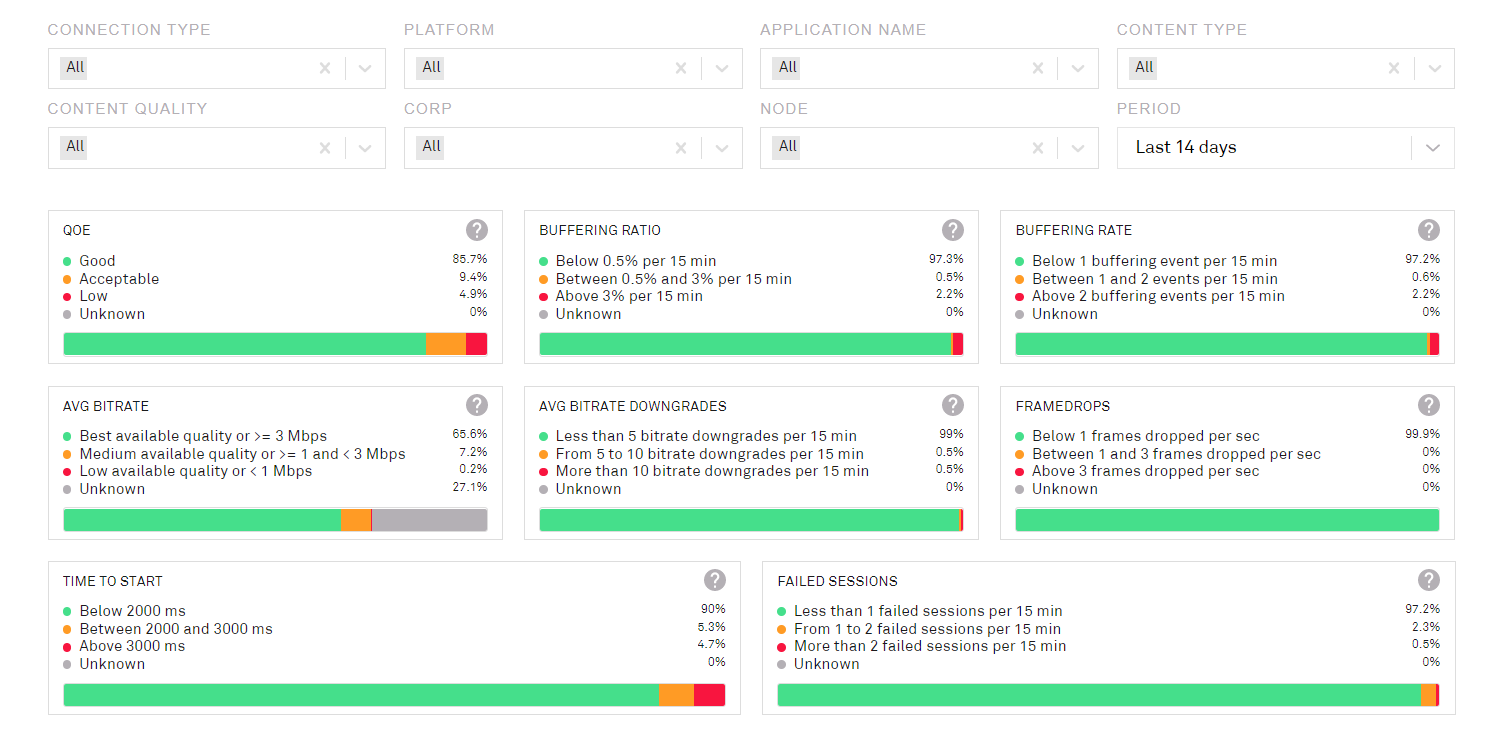
The top of the page displays an overview of the data. For a description of these metrics, click the 
Users can filter the results by:
-
Connection type
-
Platform
-
Application
-
Content type
-
Content quality
-
Corp (question)
-
Node
-
Period
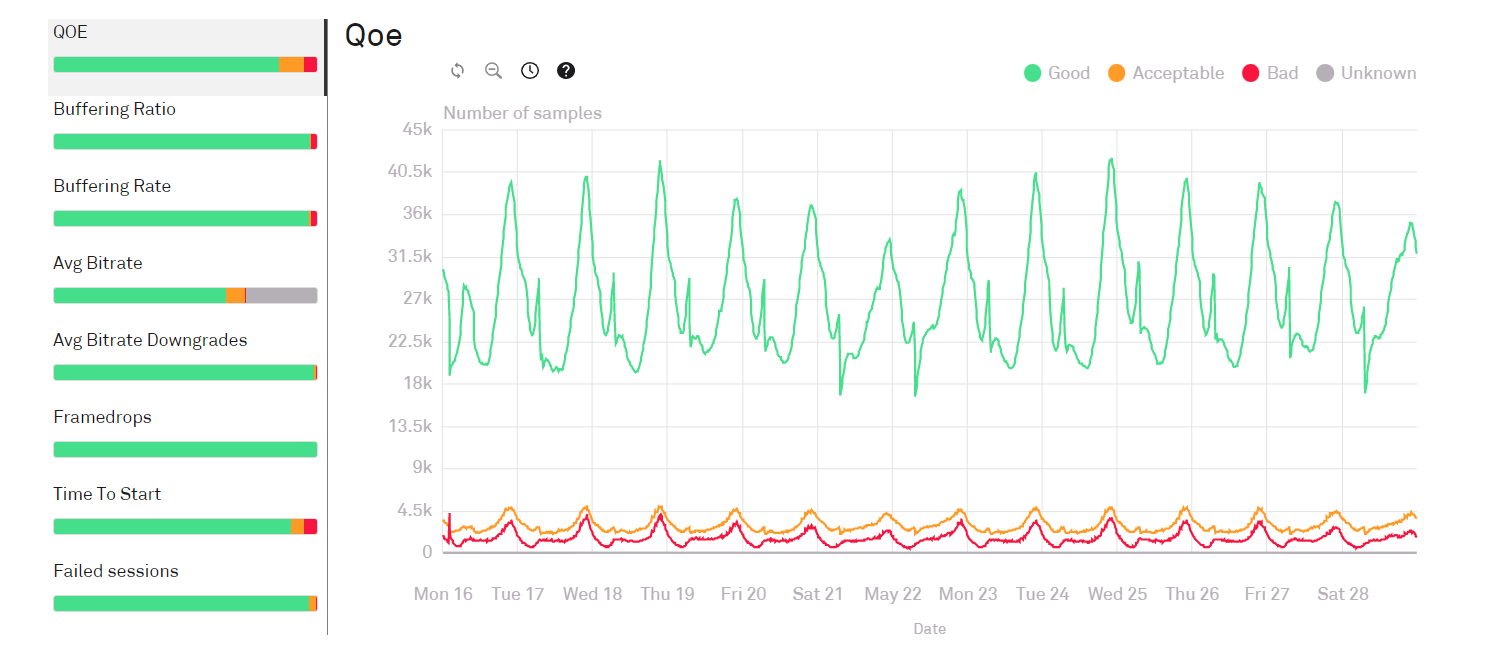
QoS Performance
These charts show a graphical representation of the above data.
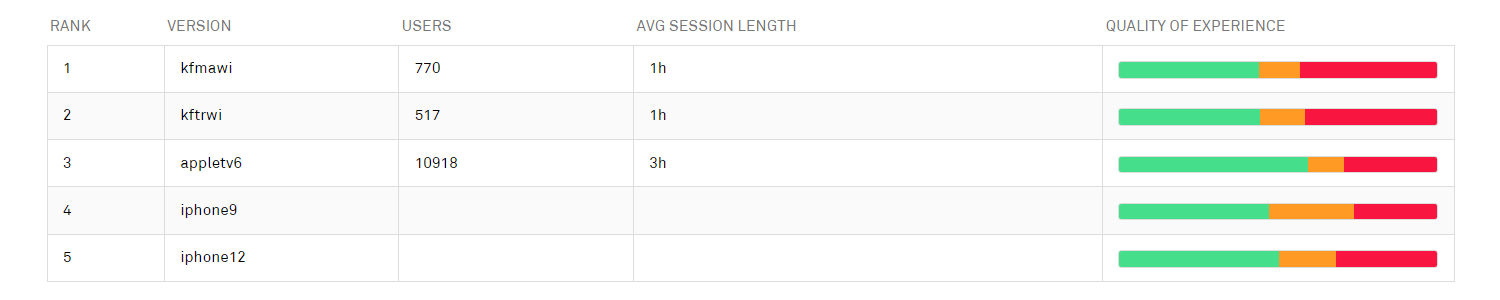
Top performing devices models
This table shows the five top-performing device models; clicking a row in this table opens the detailed information page for that model.
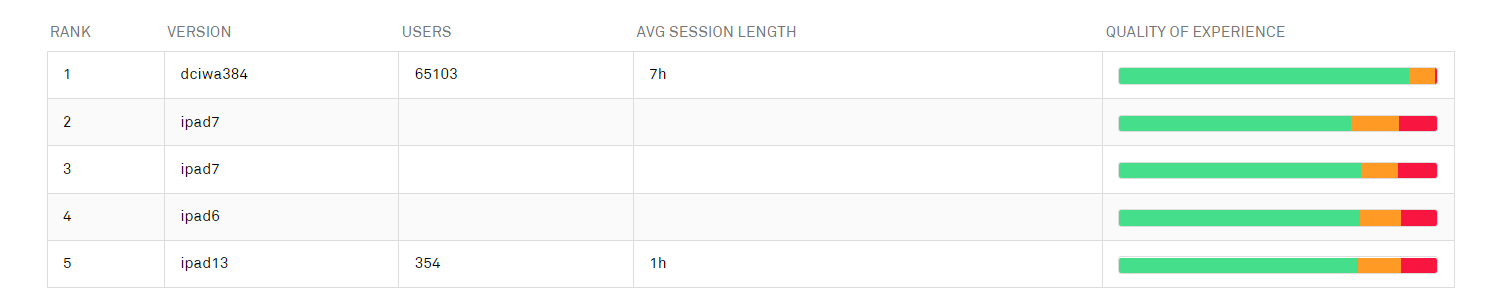
Worst performing devices models
This table shows the five worst-performing device models; clicking a row in this table opens the detailed information page for that model.