
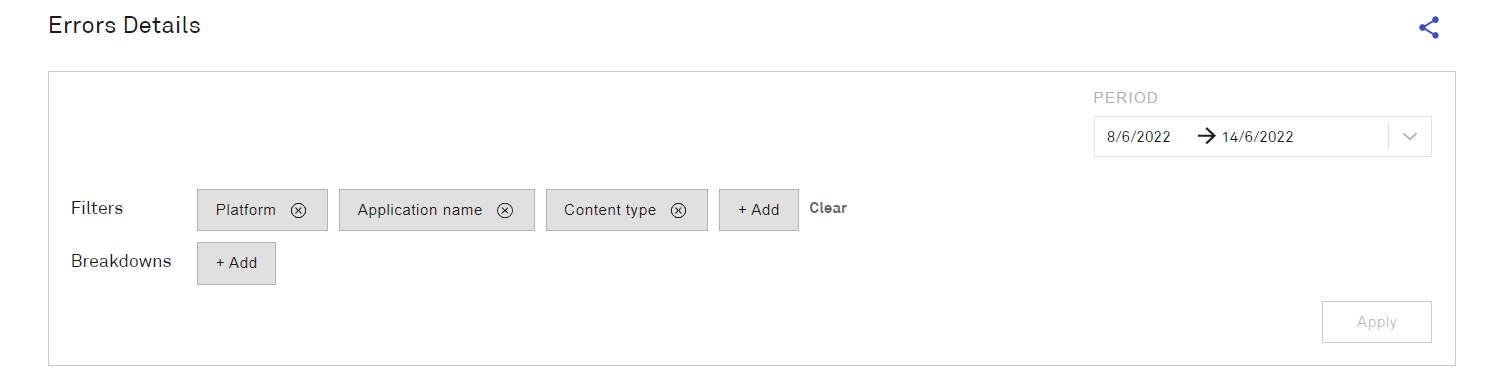
The Errors page enables users to search the data. Users can apply filters to display a list of all the errors matching the filter and break them into categories to analyse the results.

Filters for Platform, Application name and Content type are displayed by default. Users can apply additional filters by clicking the +Add button and entering the required criteria.
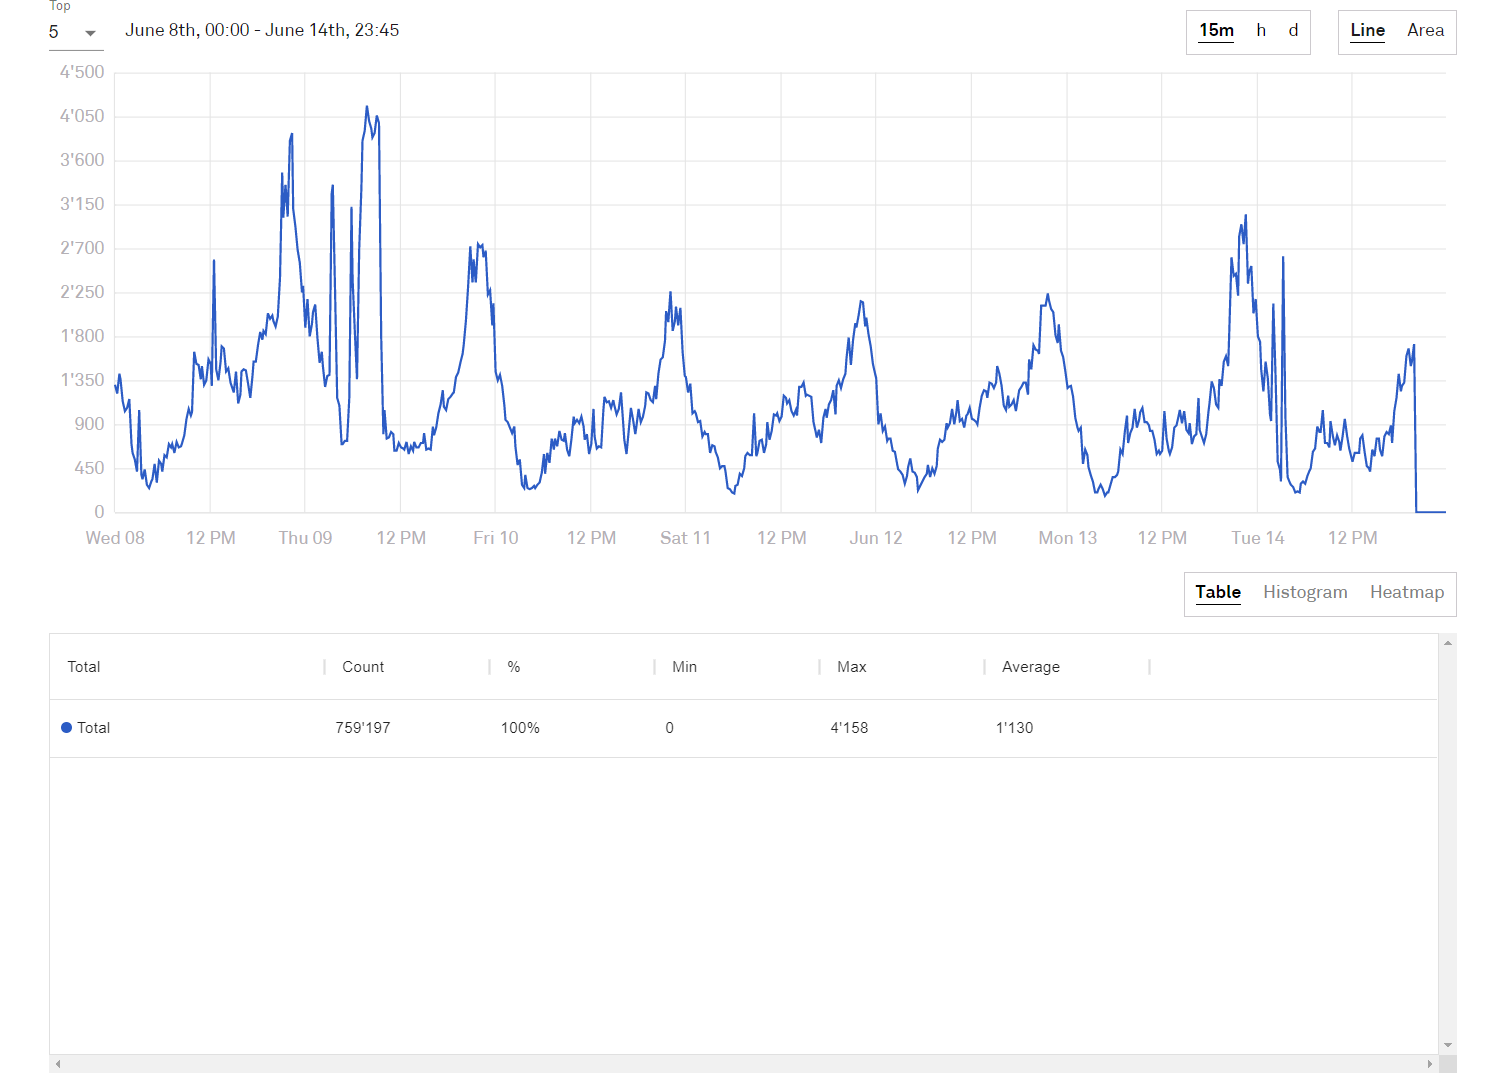
The search results for the total number of errors meeting the criteria are displayed as a chart and table. With no breakdowns applied, the total number of errors meeting the filter criteria is shown.
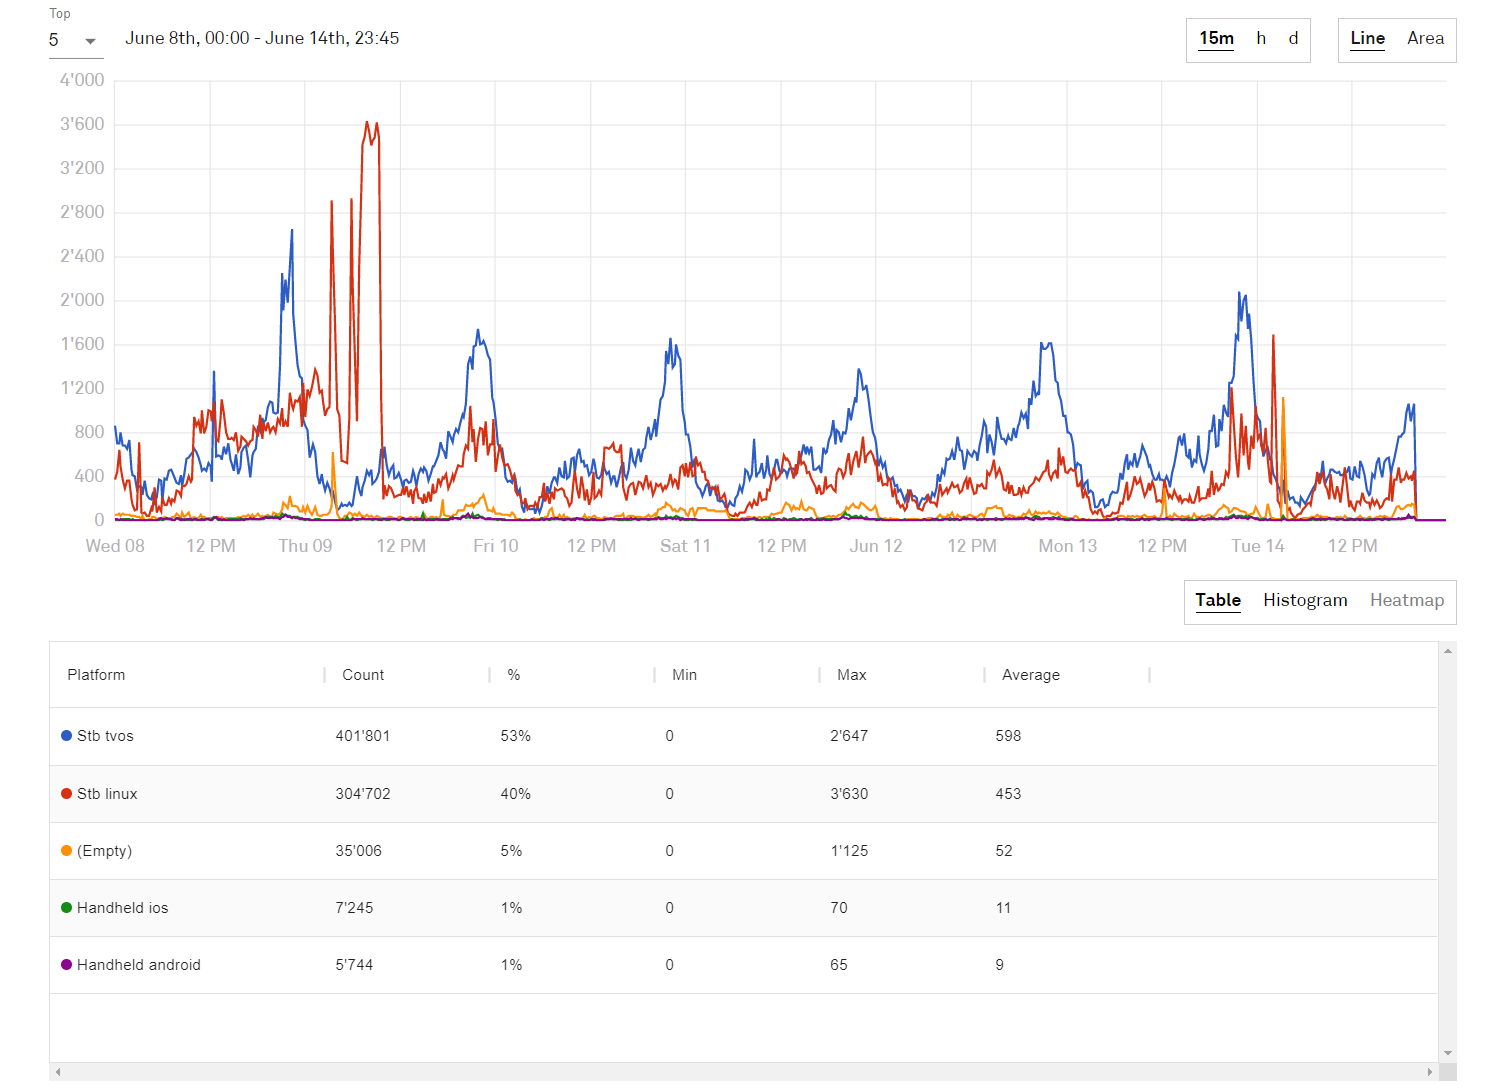
Users can break down the results by clicking the +Add button and selecting the required categories. For example, adding a breakdown for OS changes the chart and table to:
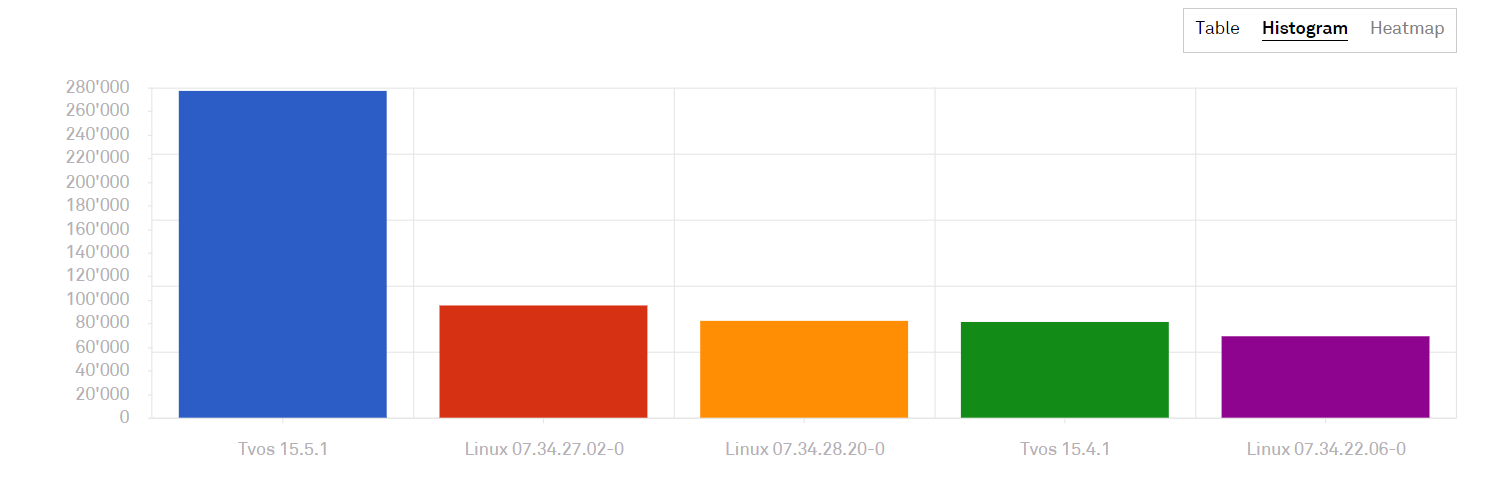
The results can also be displayed as a histogram or heatmap (not shown).
Individual devices are listed in the table.
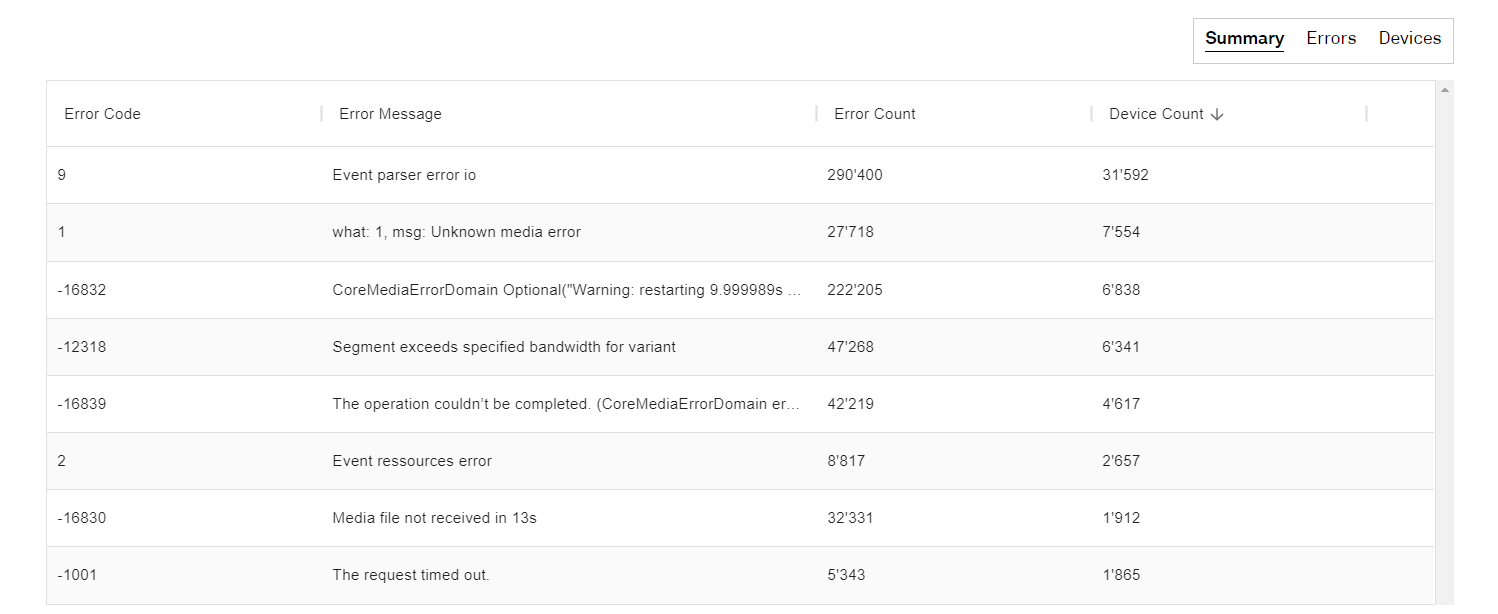
Alternatively, errors for individual devices are displayed. Highlighting and right-clicking an error code takes the user to the error page.
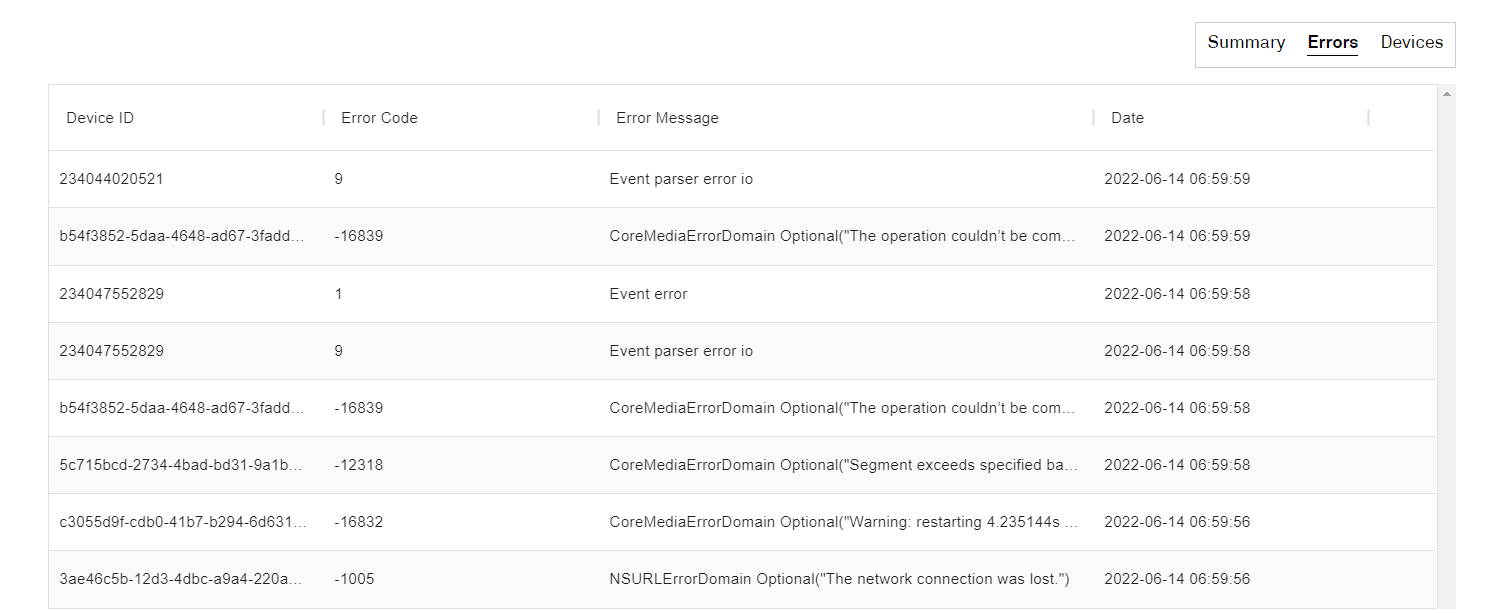
Alternatively, errors for individual devices are displayed.
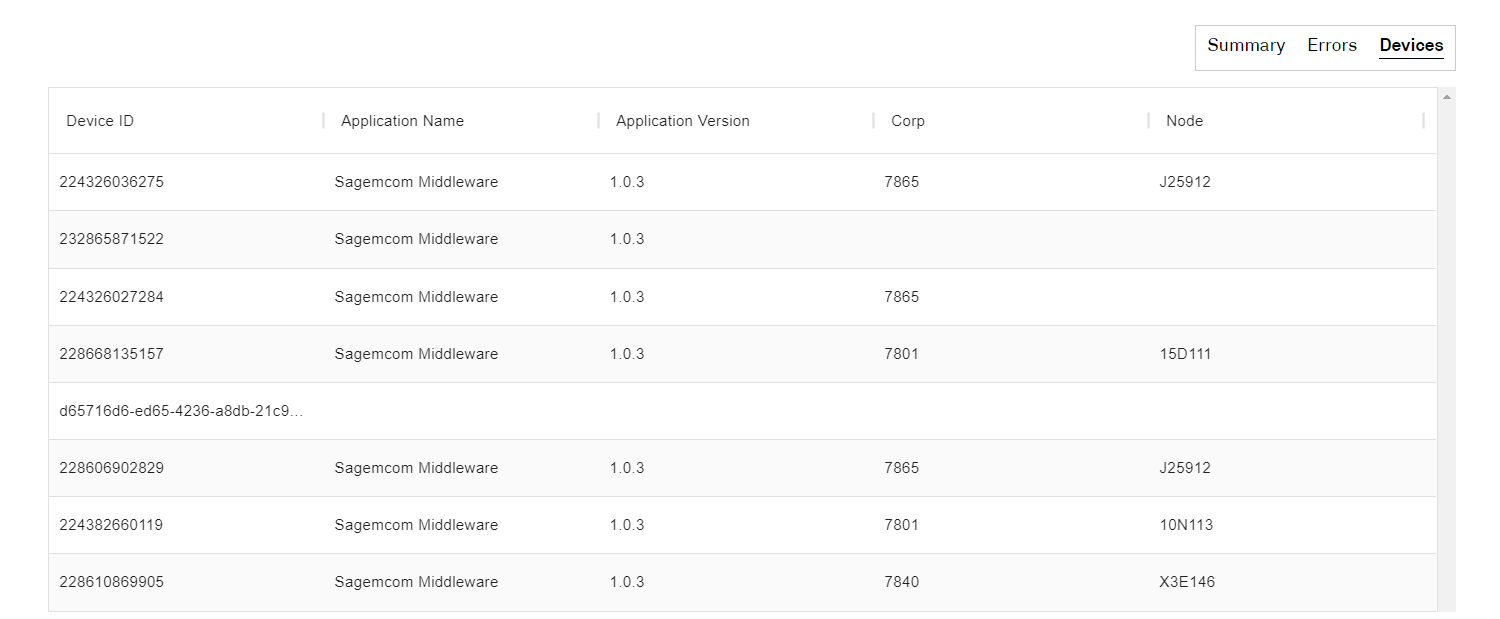
Twenty rows are displayed by default in the tables; only eight are shown in the graphics above. Clicking the Load More... button increases the table each time by twenty rows.
The data in the tables can be exported to a .CSV file by clicking the EXPORT EXCEL button.
