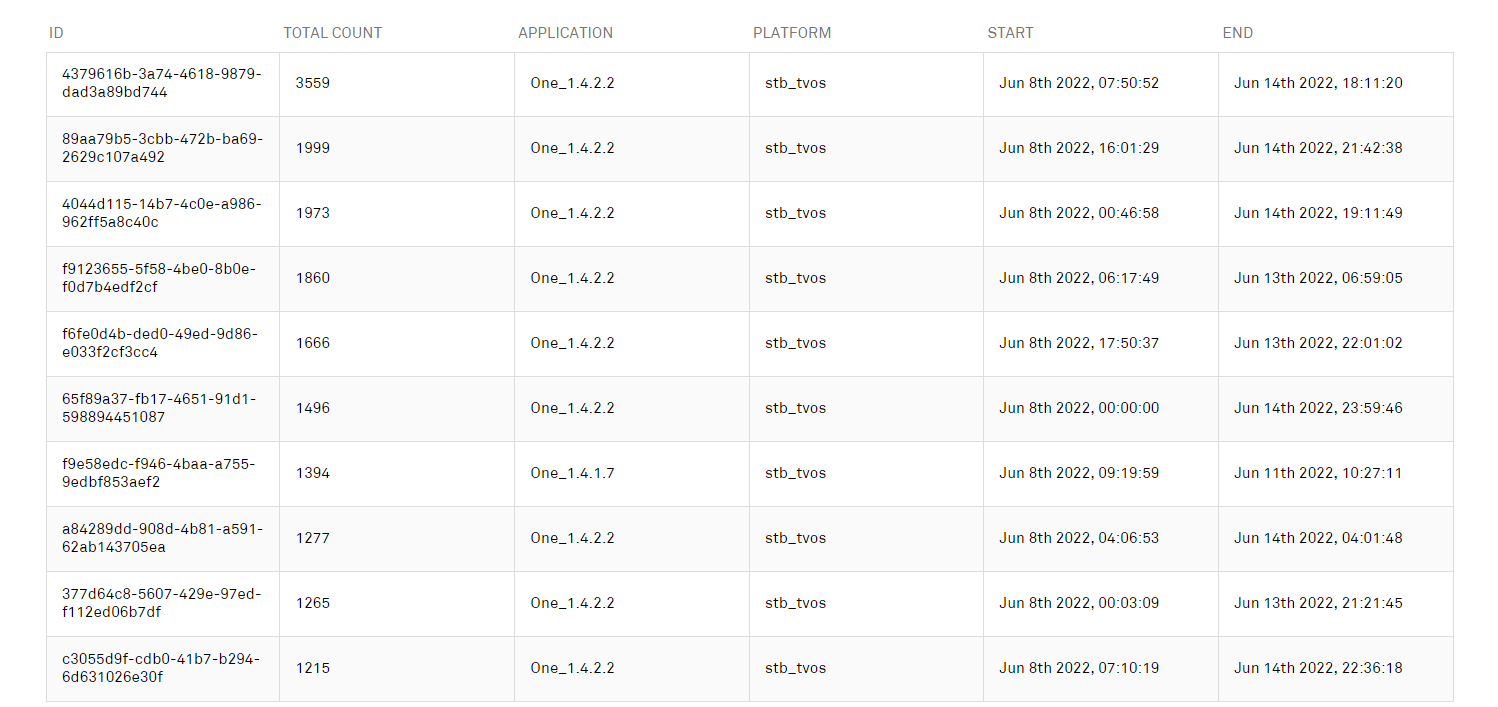
Users can display the details of a particular error code..
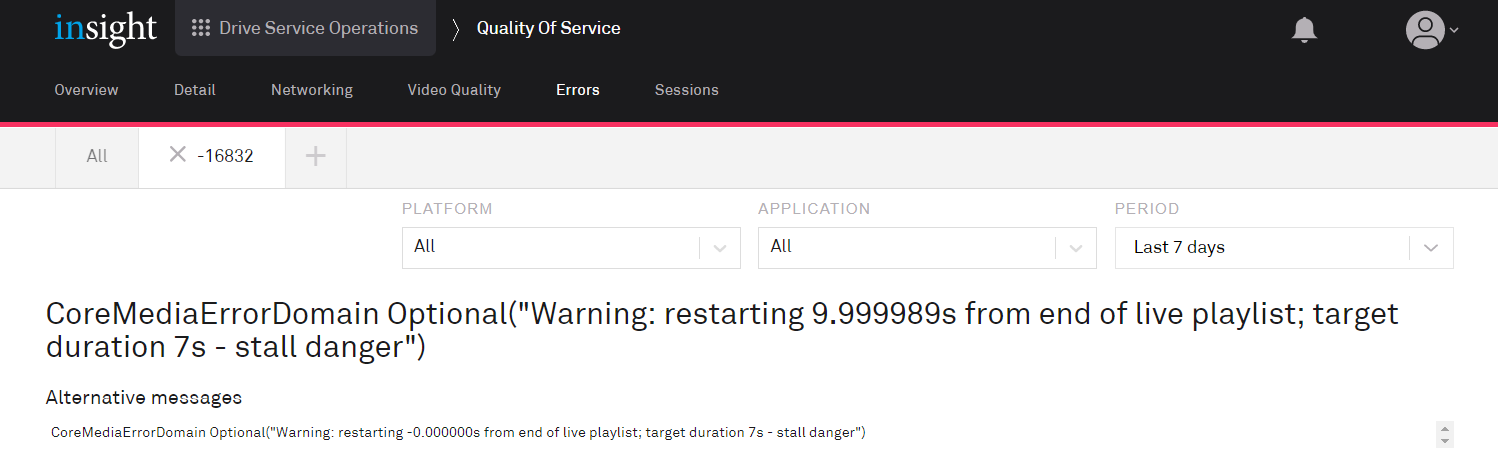
Summary
The top of the page shows a summary of the data.

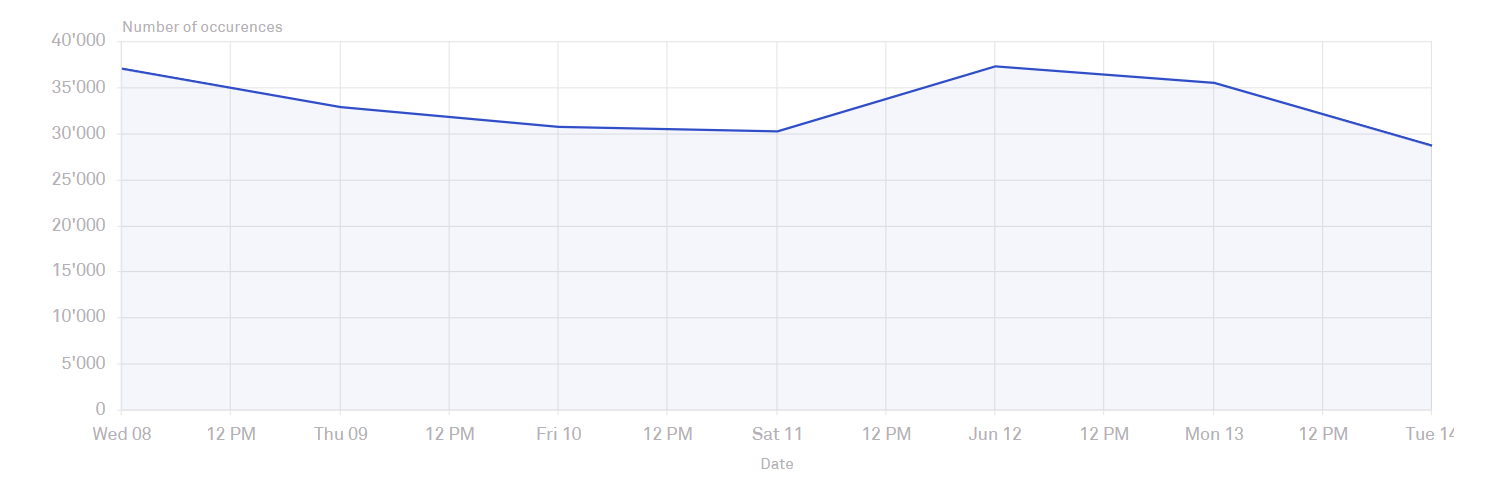
Occurrences
This chart shows the number of times the error occurred during the selected period.
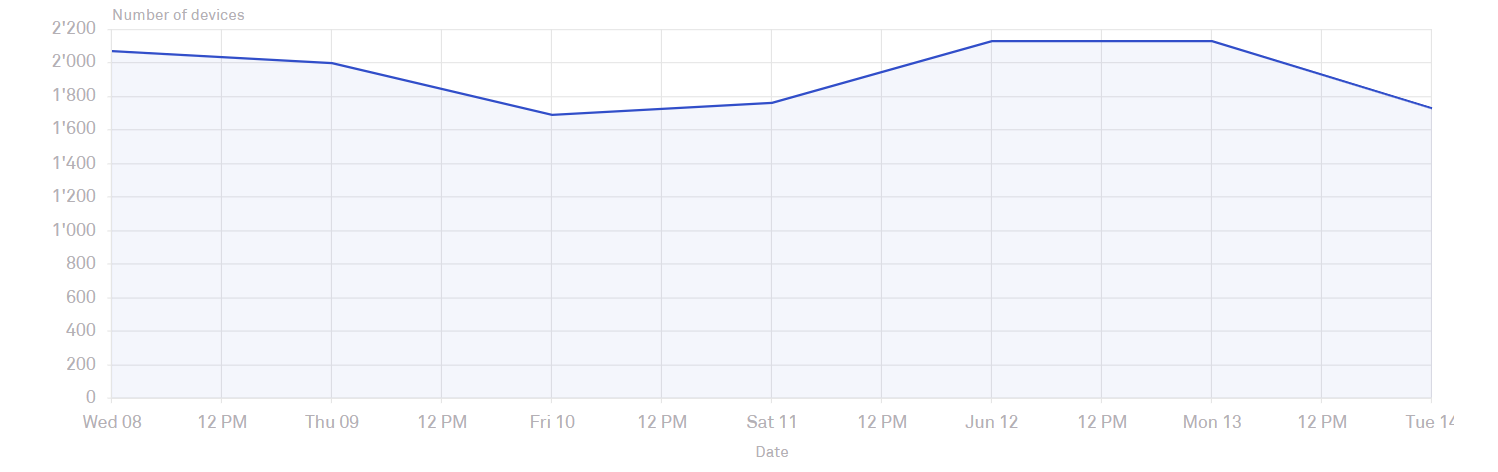
Unique Devices
This chart shows the number of devices affected by the error during the selected period.
Applications and Platforms
The table below displays the applications and platforms affected by the error during the selected period.

Most common devices
The table displays the list of the devices most affected by the error. Clicking a row in the table opens the relevant Sessions page.