
The first page provides an overview of TV metrics and analytics.

Summary
The top of the page displays a summary of the data.

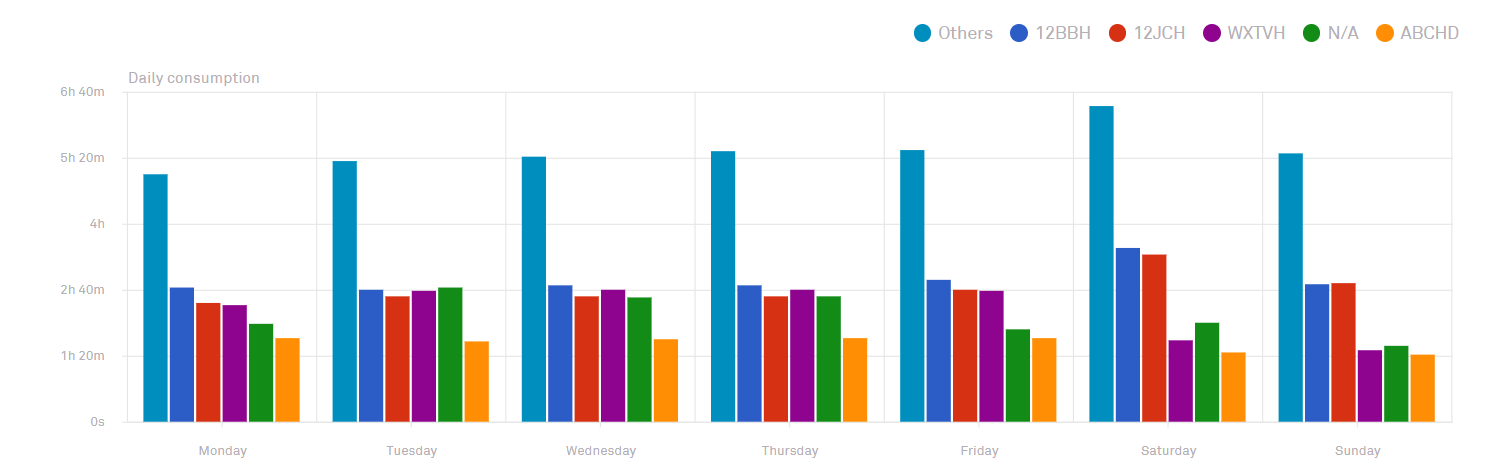
Top channels daily consumption
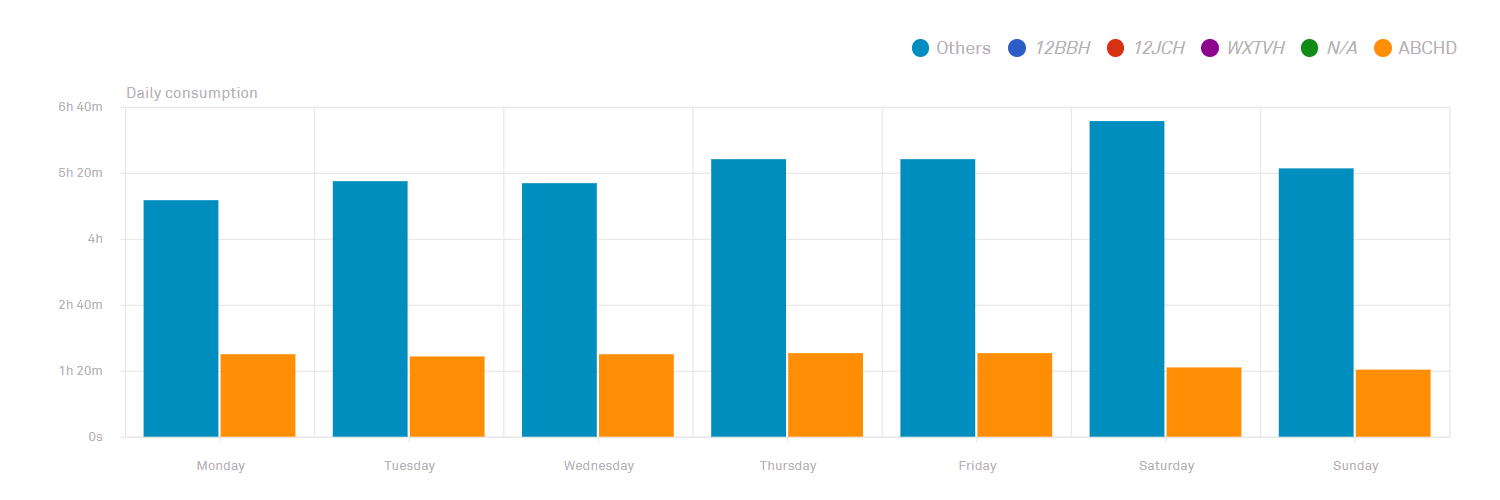
This chart shows the daily consumption of up to six TV channels.
Results can be narrowed by deselecting the unwanted channels in the list.
Channel Live audiences
This chart shows the number of viewers of TV channels.
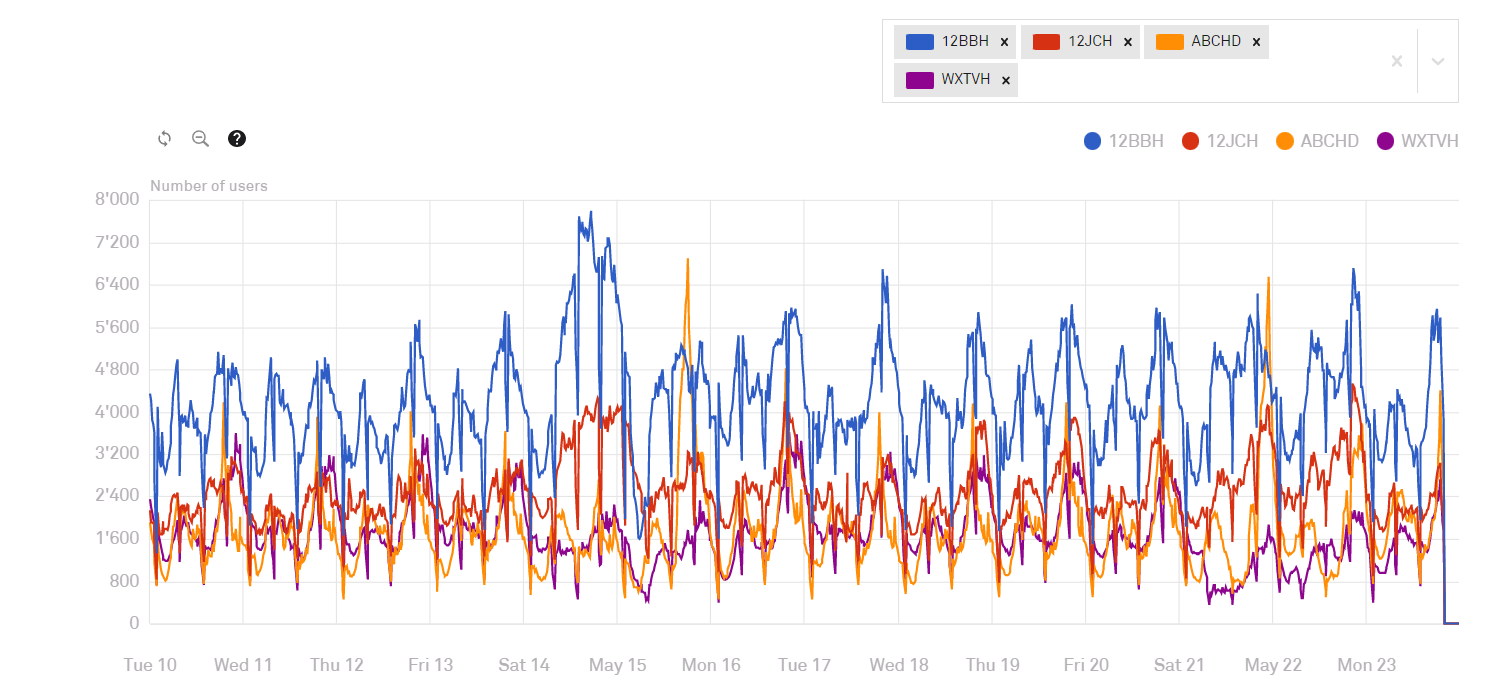
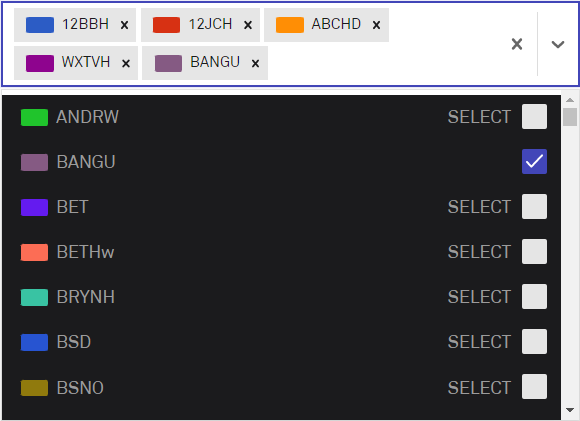
Channels can be selected or deselected in the drop-down box.
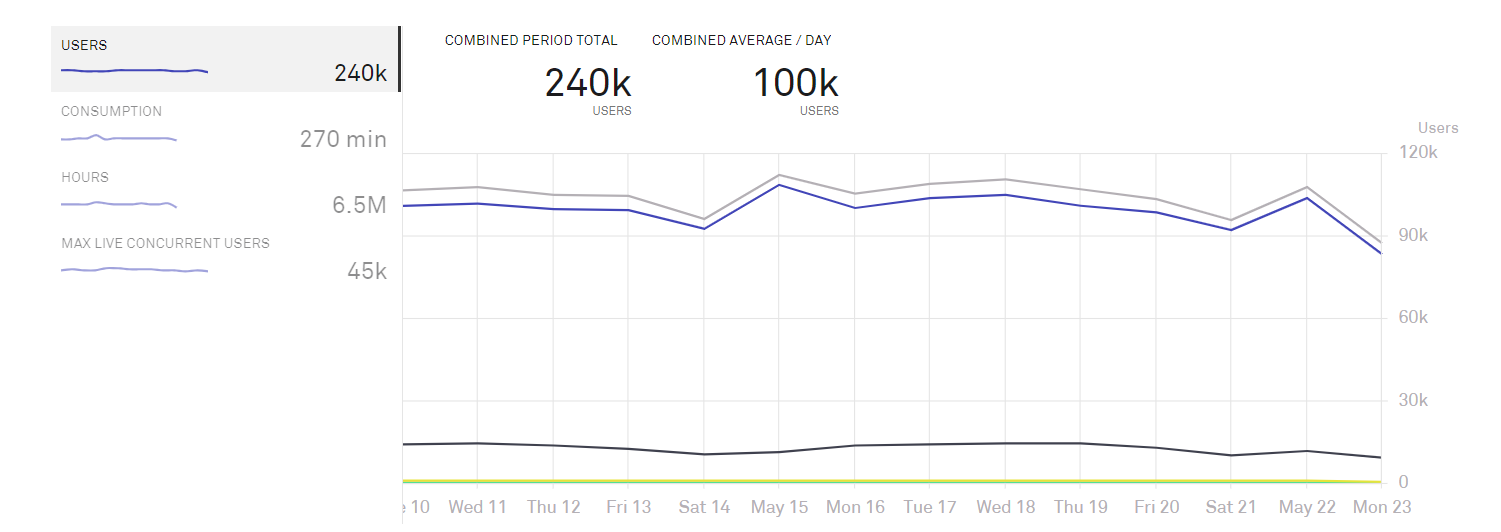
TV performance
These charts show TV performance broken down by users, consumption, hours and concurrent users.
Top five channels
This table shows the top five channels over the data period.
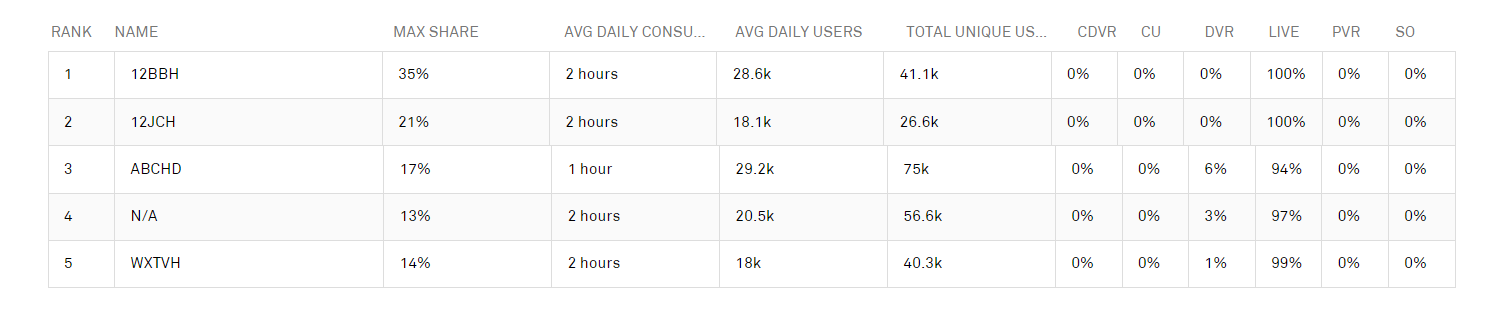
Clicking a channel displays the detailed information for that channel.
Top five programs
This table shows the top five programs over the data period.
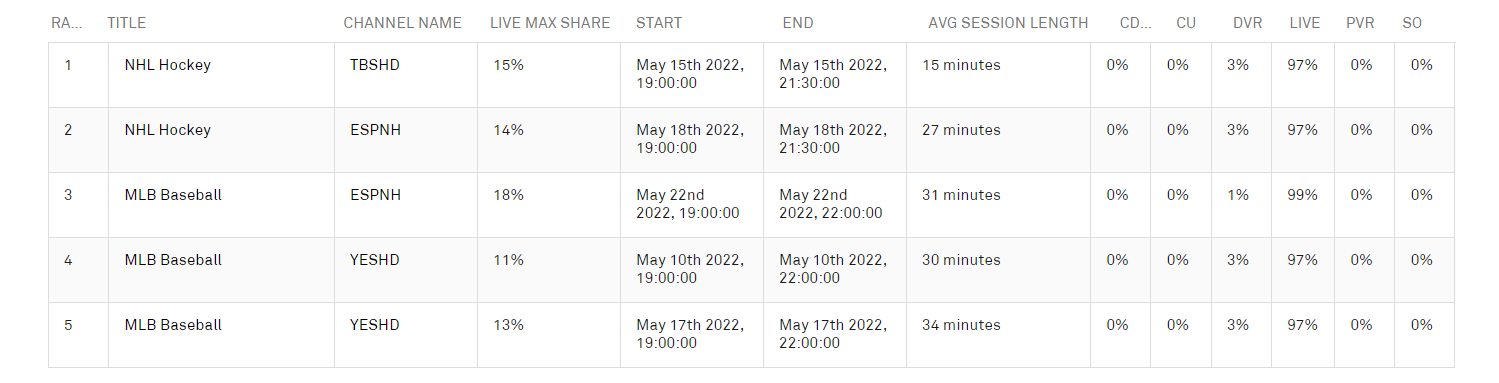
Clicking a program displays the detailed information for that program.