
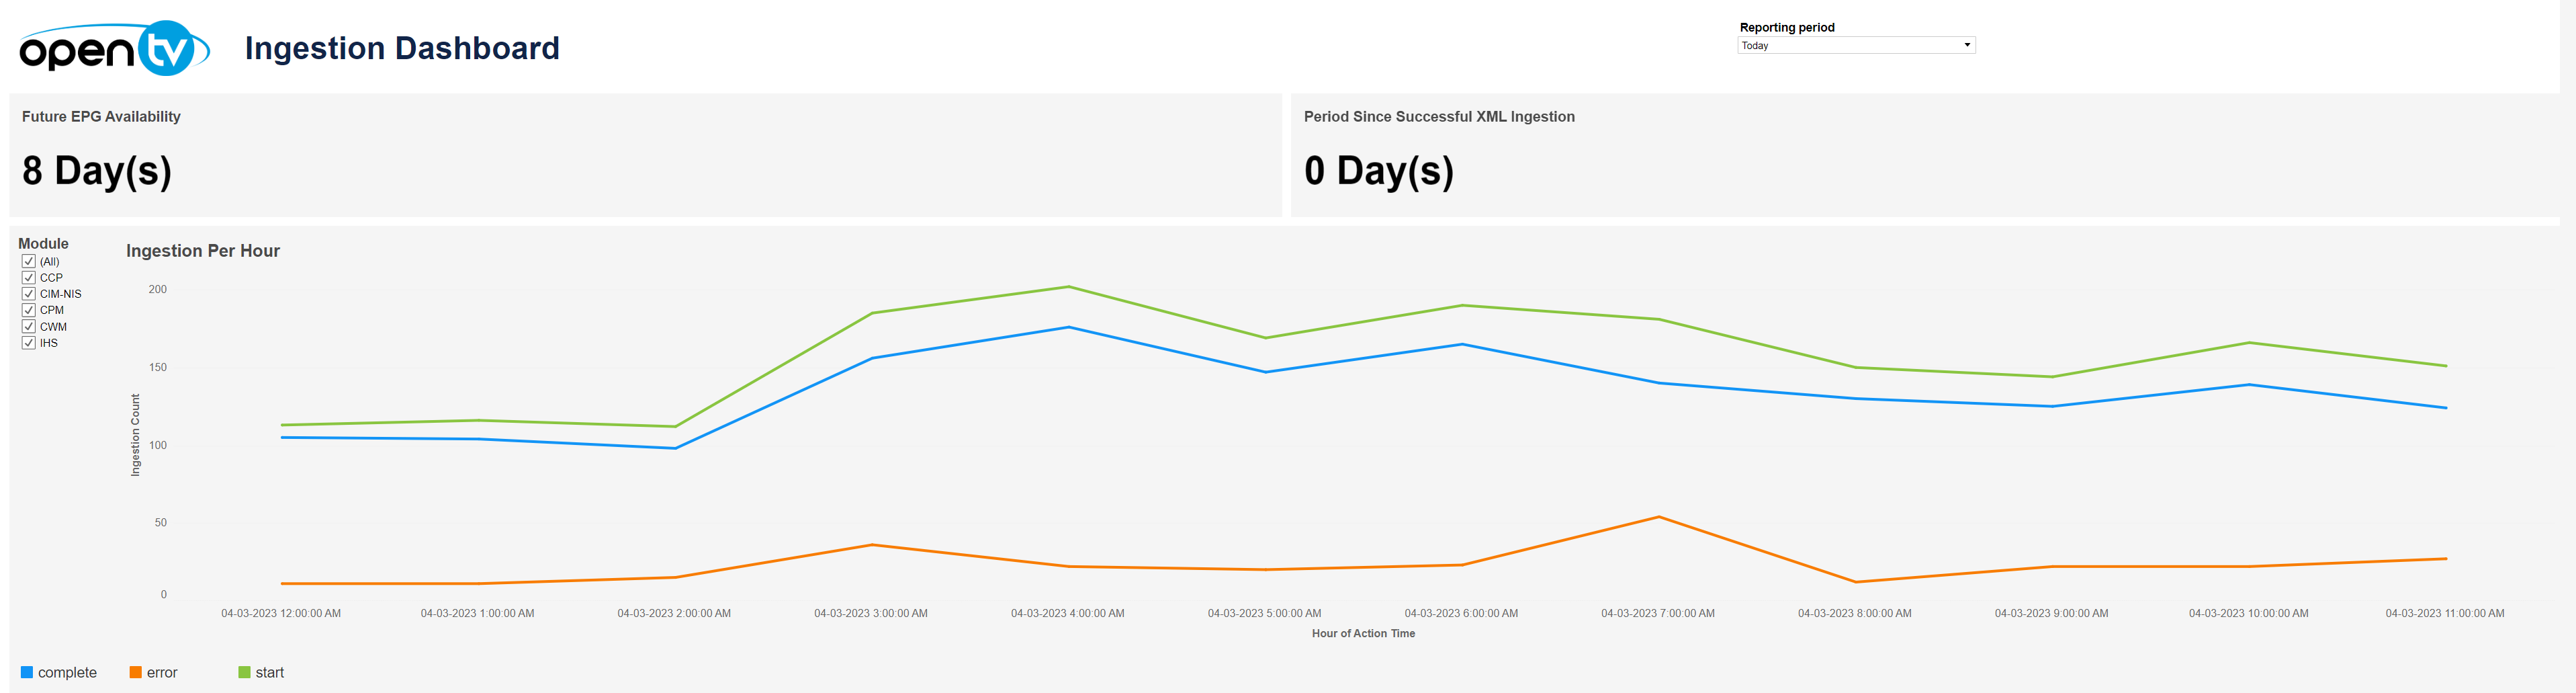
The Ingestion Dashboard comprises:
-
The number of days of future EPG availability
-
The period since the last successful XML ingest
-
An Ingestion per Hour graph
The checkboxes on the left allow you to view data for specific modules. -
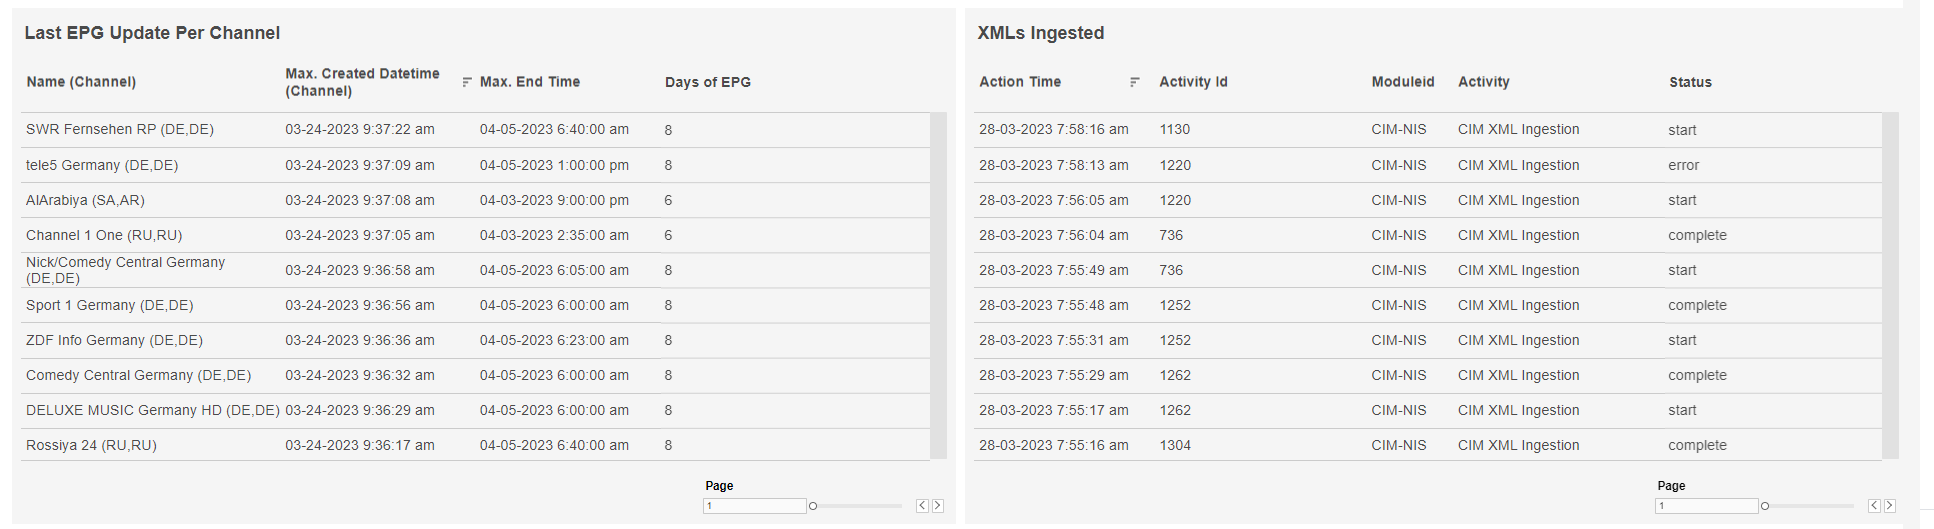
A table listing the most recent EPG updates per channel, including the number of days of EPG availability for each channel
The table lists the ten most recent updates, and has pagination controls for viewing additional rows -
A table listing the most recent XML ingests, including each one's status
The table lists the ten most recent ingests, and has pagination controls for viewing additional rows
At the top of the page, you can:
-
Change the date range.
In each tile, you can:
-
Hover over or click the data or chart to see additional information.
-
Click and continue hovering over the tile, then click

In this window, you can:-
See more detailed data, including (for some categories) a list of the accounts that comprise the total shown in the tile.
-
Change the sort order.
-
Show and hide fields.
-
Change the number of rows displayed.
-
Download the data.
-