
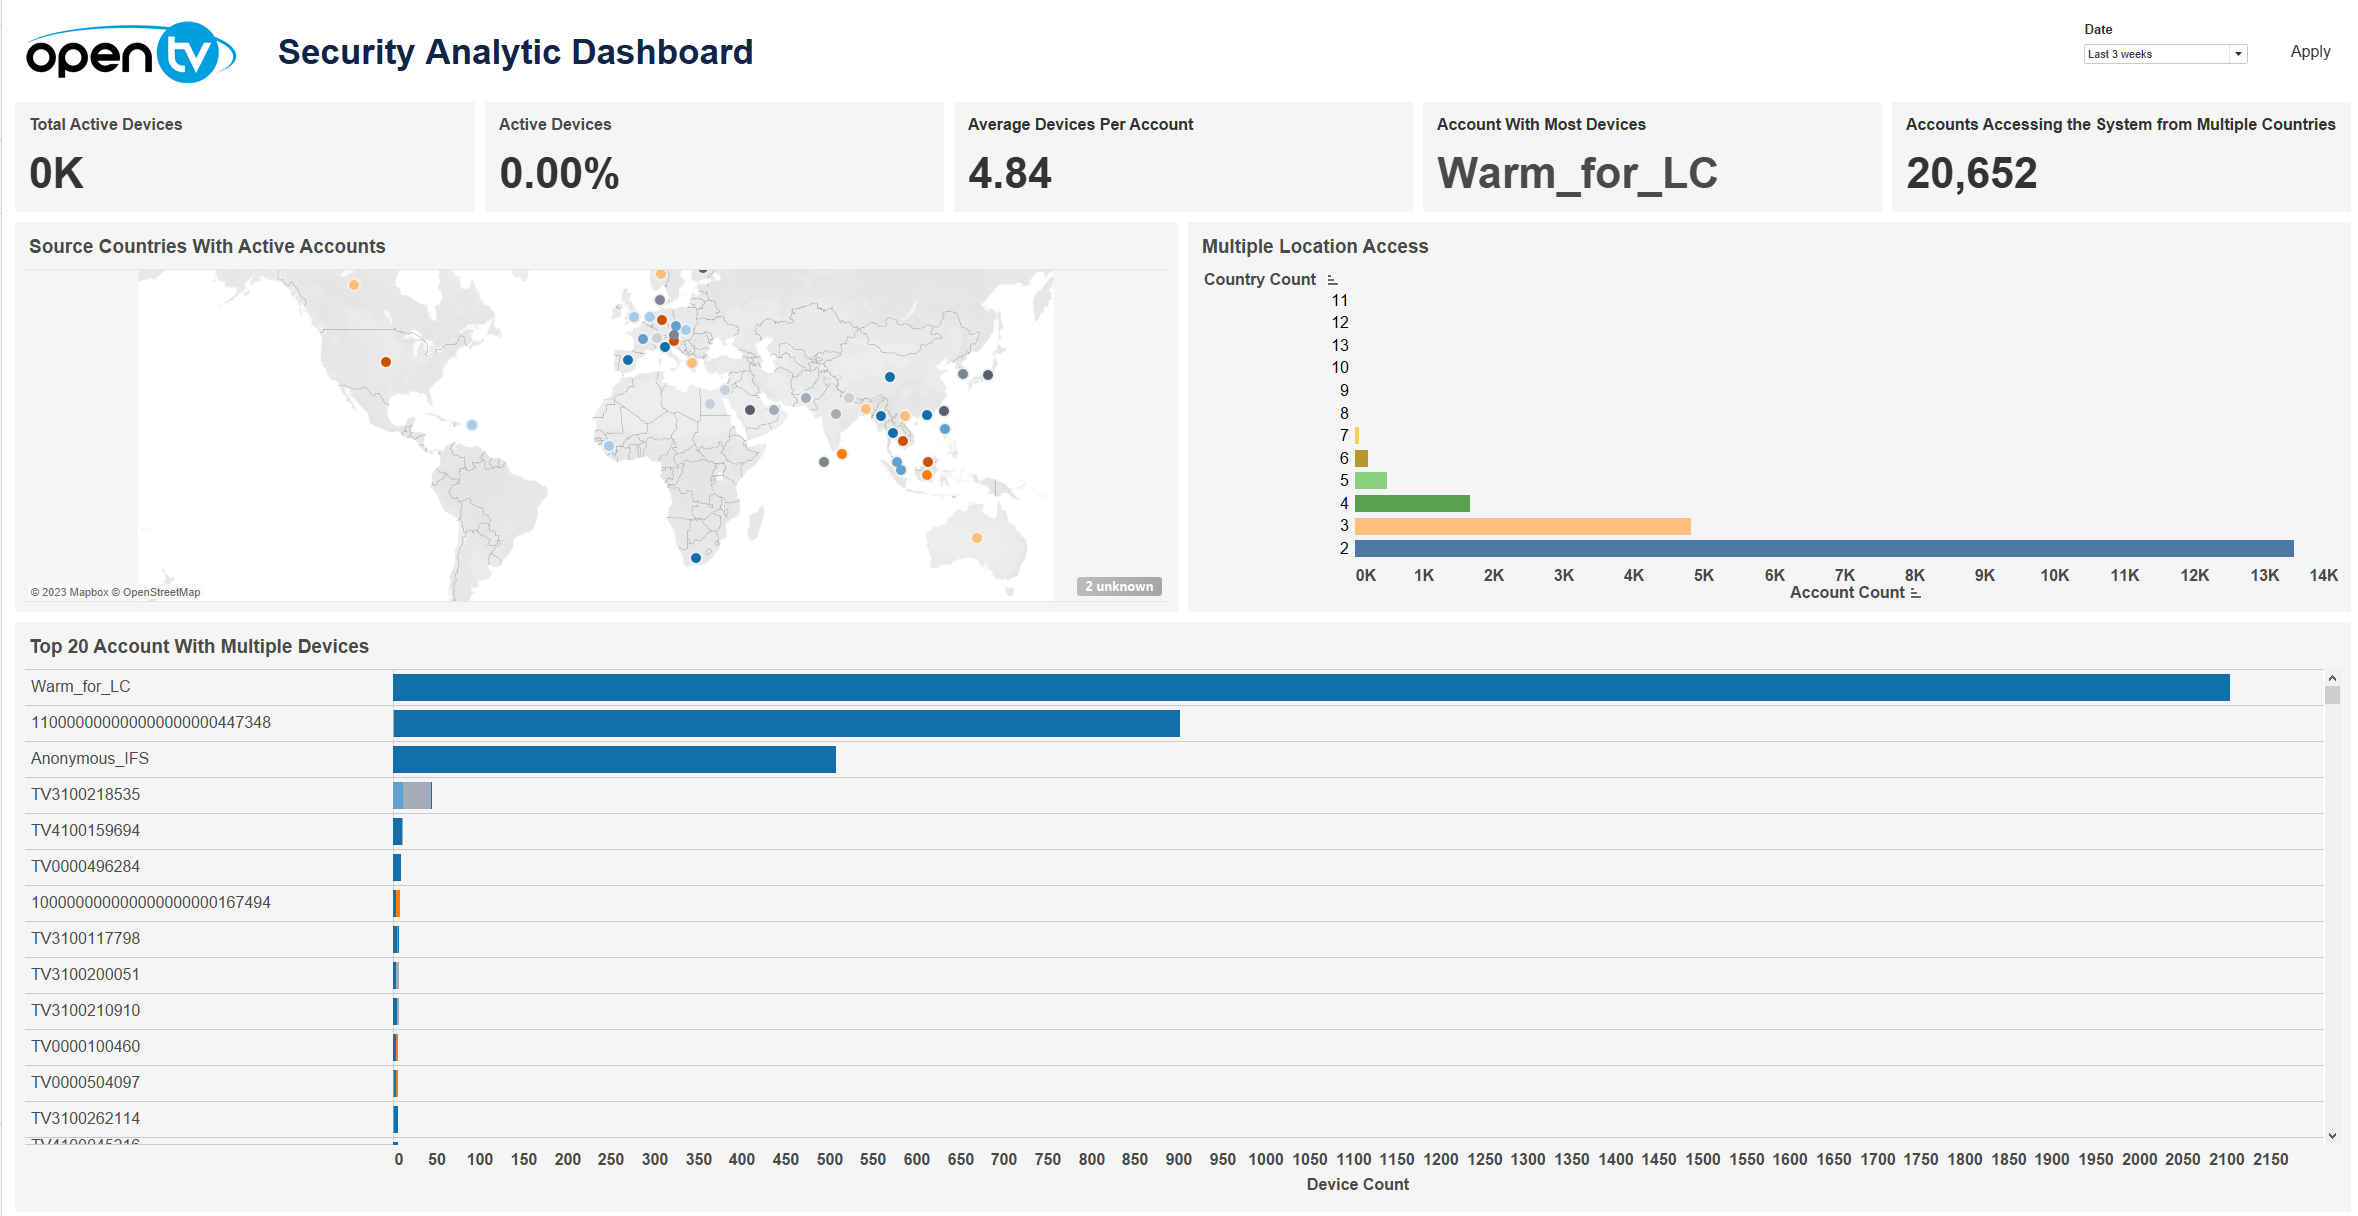
The Security Analytic Dashboard displays a variety of security-related information, including:
-
The total number of active devices
-
The change in active devices compared to the previous period
-
The average number of devices per account
-
The ID of the account with the highest number of devices
-
The number of accounts that have accessed the system from multiple countries
-
A map showing the countries with active accounts
-
A chart showing country count against account count
-
A chart showing the top 20 accounts by number of devices (with each bar sectioned by device type)
At the top of the page, you can:
-
Change the date range
In each tile, you can:
-
Hover over or click the data or chart to see additional information.
-
Click and continue hovering over the tile, then click

In this window, you can:-
See more detailed data, including (for some categories) a list of the accounts that comprise the total shown in the tile.
-
Change the sort order.
-
Show and hide fields.
-
Change the number of rows displayed.
-
Download the data.
-
In Top 20 Account with Multiple Devices, you can click on a bar in the chart or an account name, then click Goto Account Detail to drill down into the selected account.