
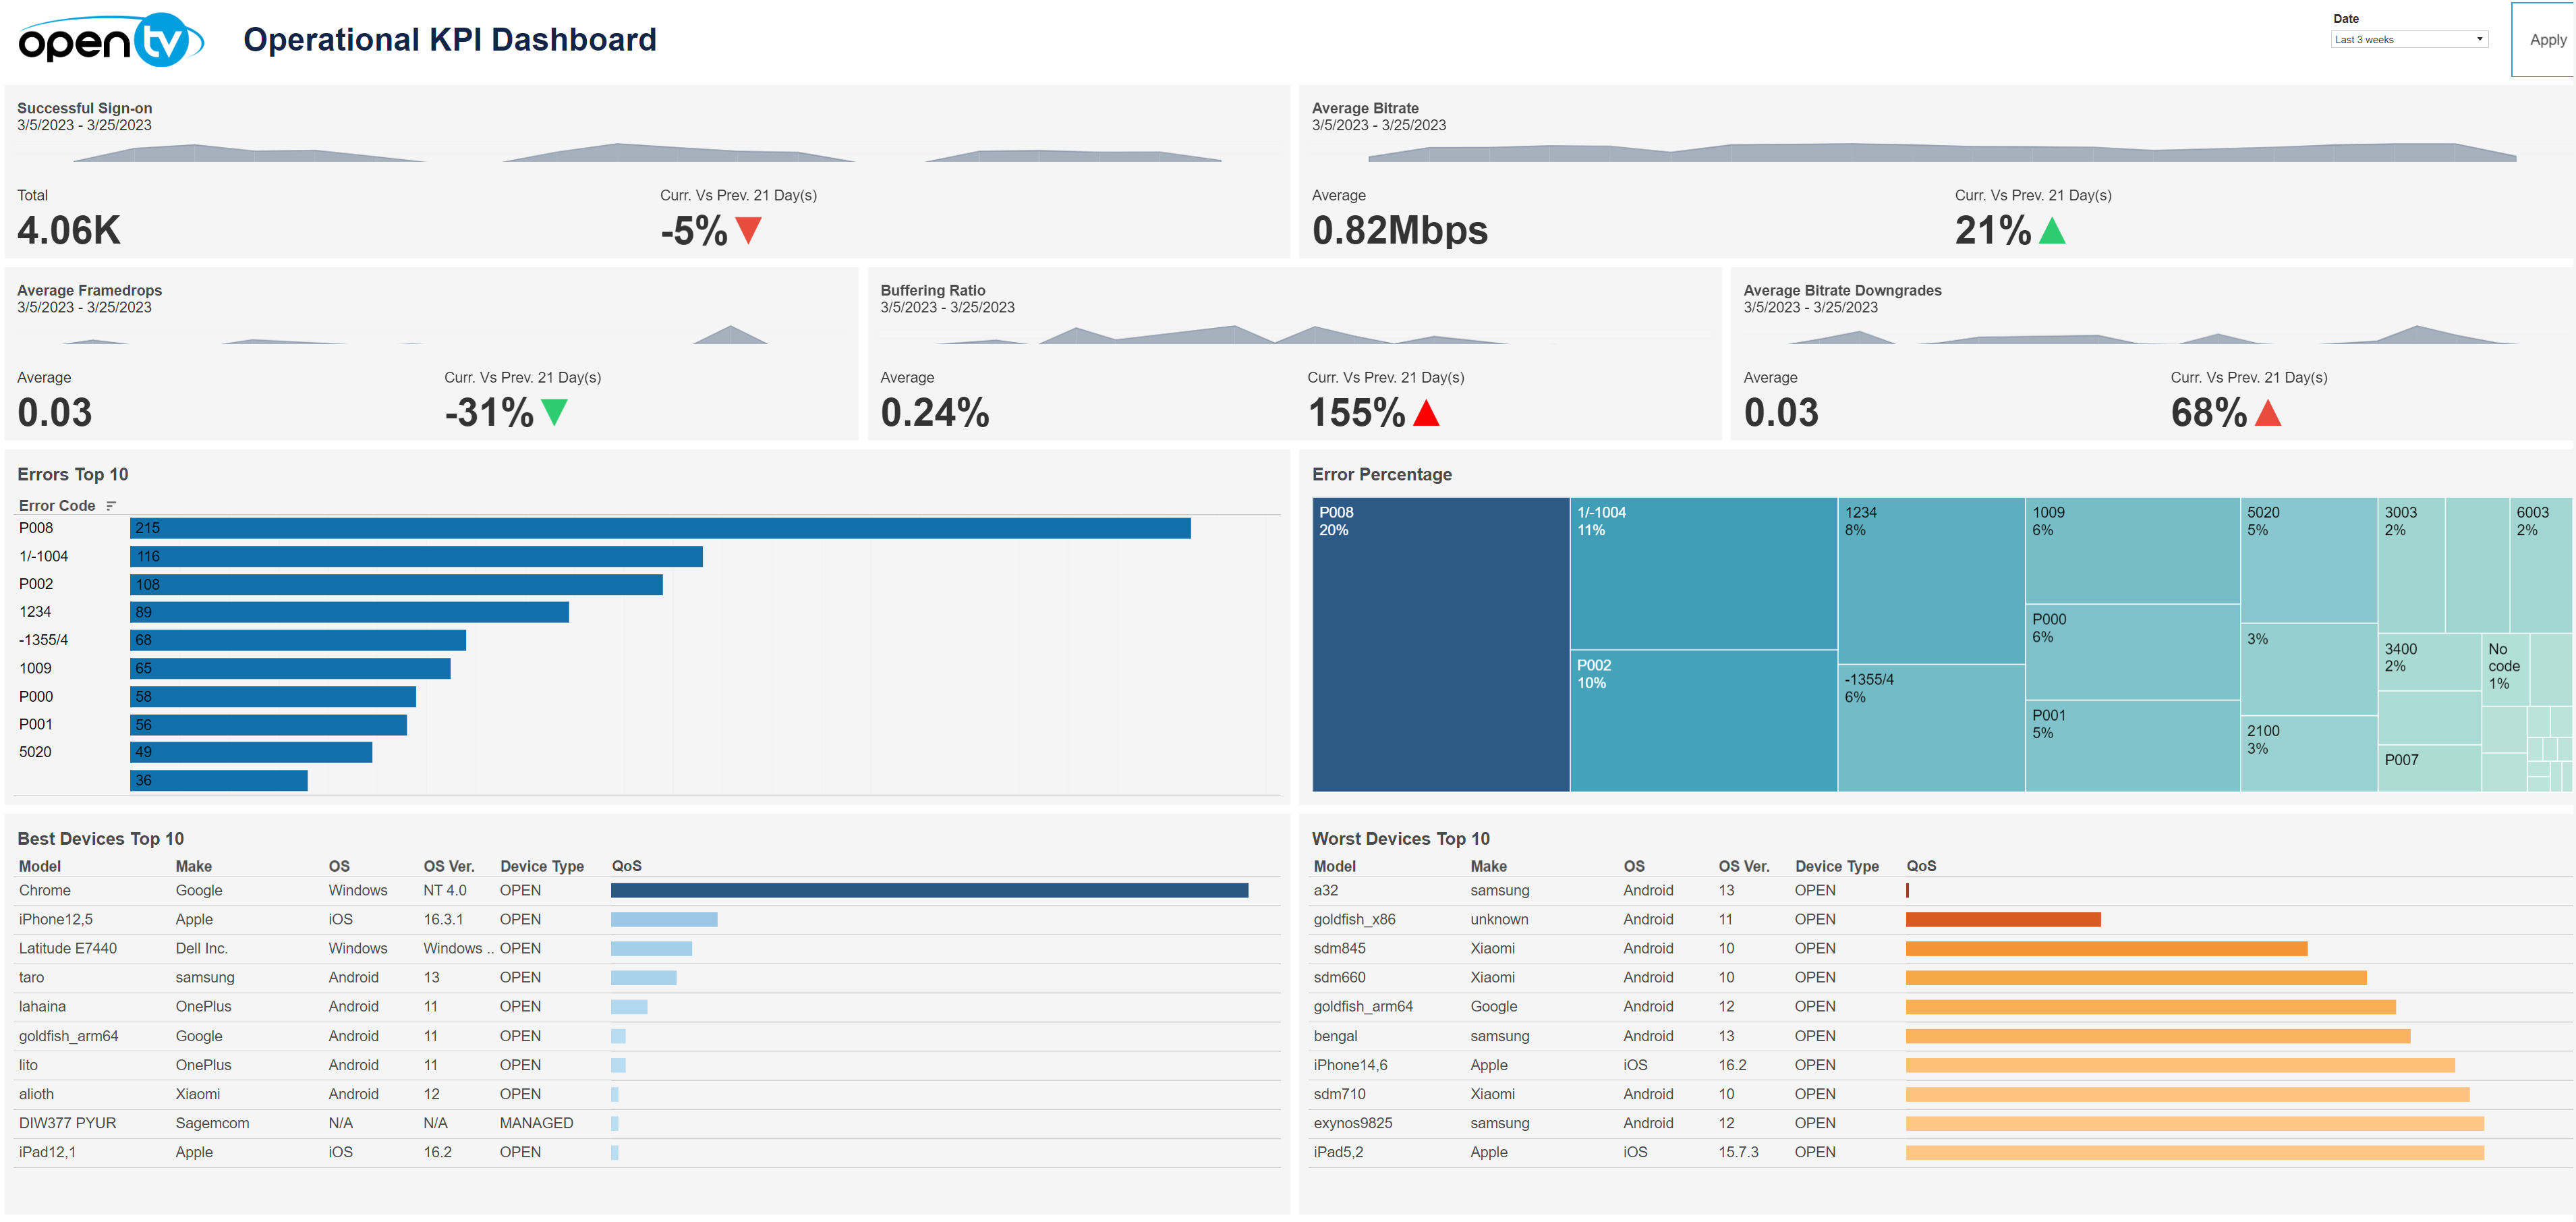
The Operational KPI Dashboard contains a variety of operational information for the selected time period, including:
-
The number of successful signons and change from previous period
-
Average bitrate and change from previous period
-
Average framedrops and change from previous period
-
The buffering ratio and change from previous period
-
Average bitrate downgrades and change from previous period
-
A chart of the top 10 errors by number
-
A chart of errors by percentage
-
A table of the 10 best devices sorted by QoS score (in descending order by default)
-
A table of the 10 worst devices sorted by QoS score (in ascending order by default)
At the top of the page, you can:
-
Change the date range
In the overview section, for each tile, you can:
-
Hover over or click the data or chart to see additional information.
-
Click the data or chart and then click

In this window, you can:See more detailed data, including (for some categories) a list of the accounts that comprise the total shown in the tile.Change the sort order.Show and hide fields.Change the number of rows displayed.Download the data.