
Account Dashboard | Overview
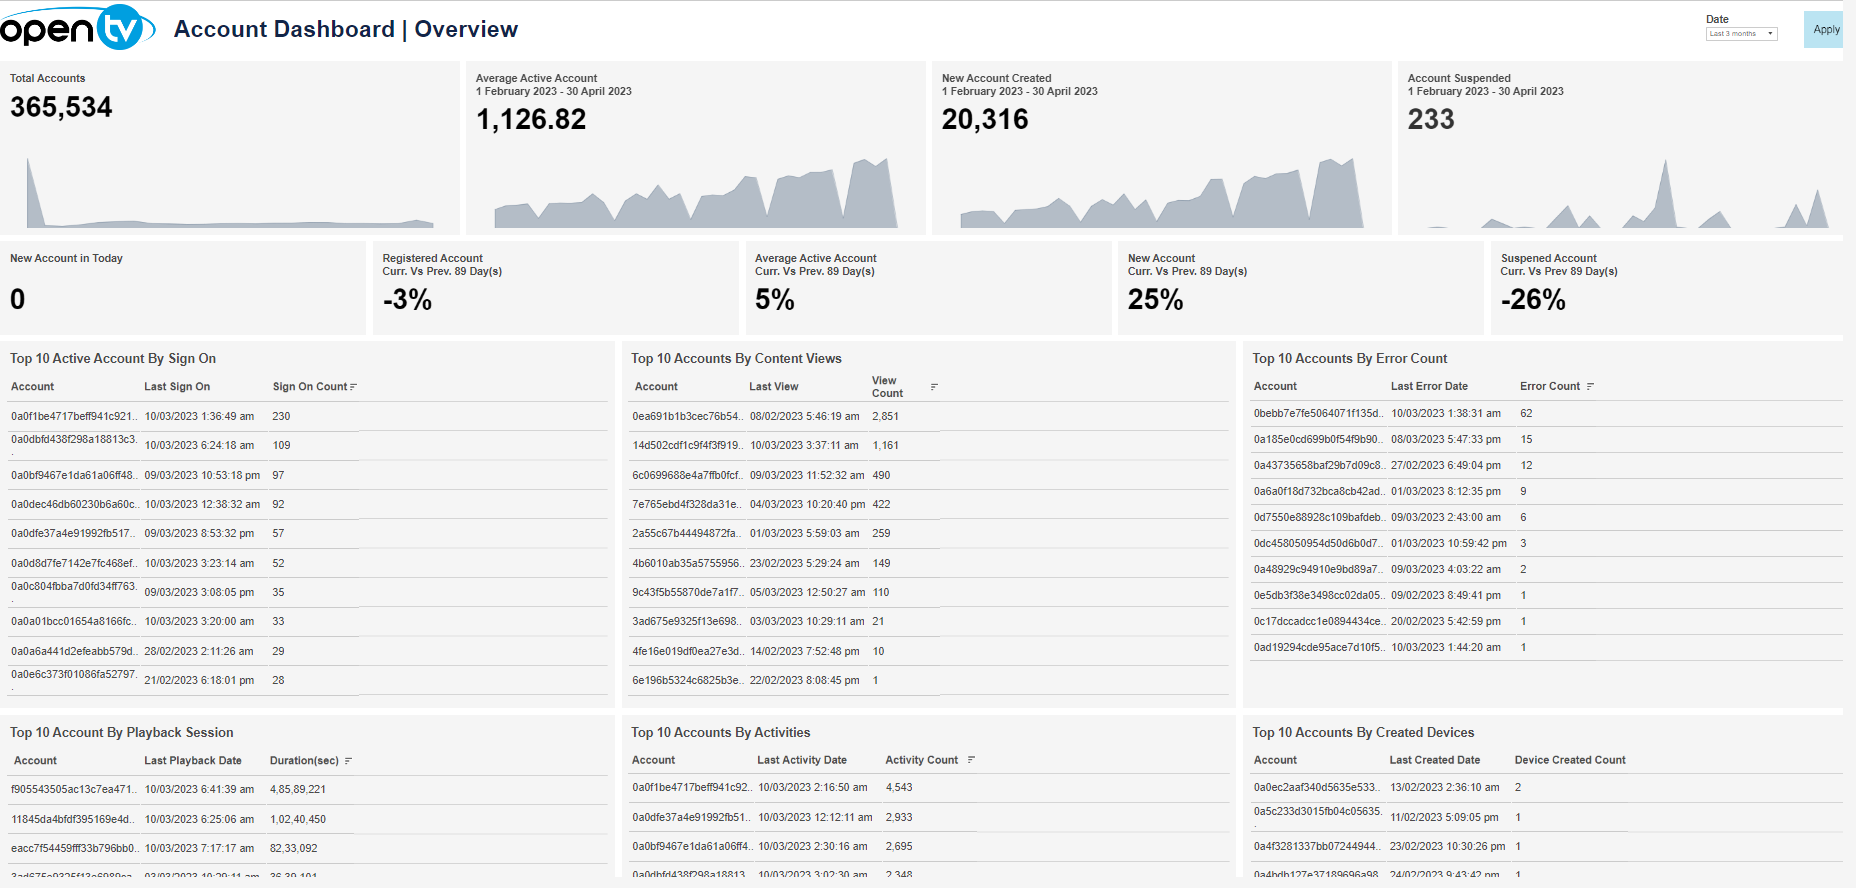
The Overview tab lets you see a variety of account-related data for the selected time period, including:
-
Total number of accounts
-
Average number of active accounts per day
-
Number of new accounts (for the last last 24 hours and for the selected time period)
-
Number of account suspensions in the selected time period
-
Number of new accounts today
-
Comparisons of the following between the current 24-hour-period and the previous 24-hour period:
-
Total registered accounts
-
Active accounts
-
New accounts
-
Suspended accounts
-
-
Top accounts by:
-
Number of sign-on
-
Number of unique content views
-
Number of errors
-
Playback duration
-
Number of activities
-
Number of created devices
-
At the top of the page, you can:
-
Change the date range
In the overview section, for each tile, you can:
-
Hover over or click the data or chart to see exact numbers.
-
Click the data or chart and then click

to open the View Data window for the selected data category.
In this window, you can:-
See more detailed data, including (for some categories) a list of the accounts that comprise the total shown in the tile.
-
Change the sort order.
-
Show and hide fields.
-
Change the number of rows displayed.
-
Download the data.
-
In the top accounts sections, you can click on a row to open the Account Details tab for the selected account.
Account Dashboard | Details
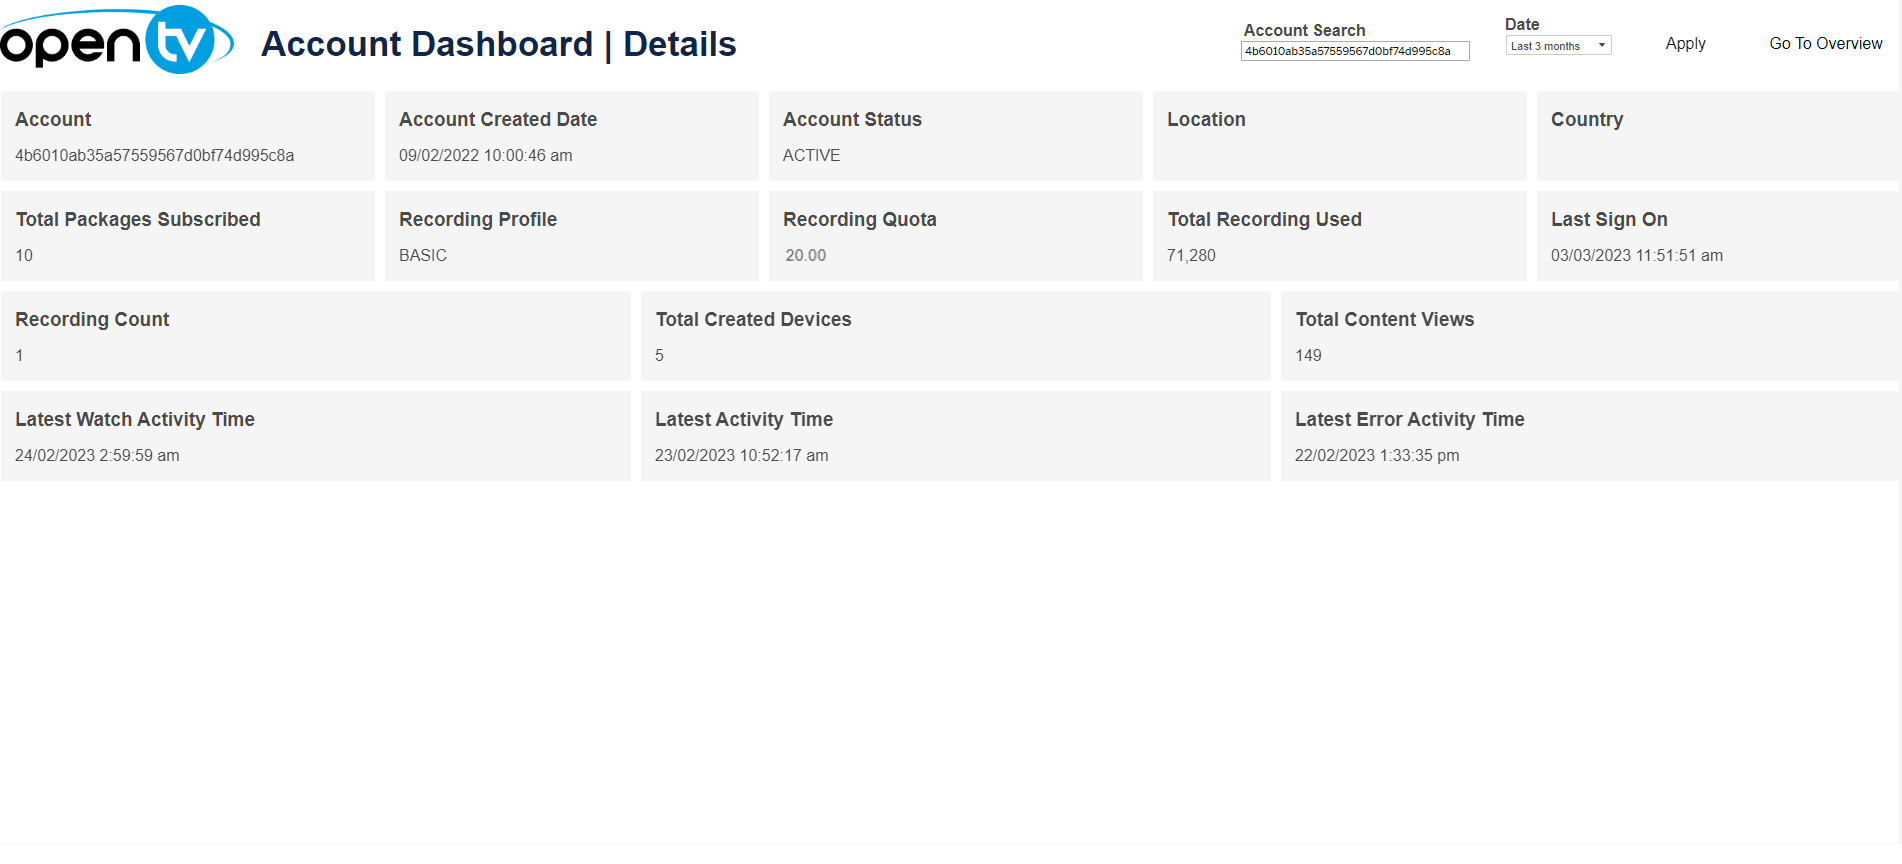
The Details tab shows detailed data for the selected account, including:
-
Account signon ID
-
Account creation date
-
Account status
-
Location
-
Country
-
Packages subscribed (Clicking on the data takes you to the Account Dashboard | Packages Subscribed for the account.)
-
Recording profile
-
Recording quota size and usage
-
Last sign-on time
-
Recording count
-
Total number of created devices
-
Content views
-
Latest watch activity time
-
Latest activity time
-
Latest error activity time
As in the Account Dashboard | Overview tab, you can click on any of these to open the View Data window, which shows more detailed data (see above).
At the top of the page, you can:
-
Change the date range
Account Dashboard | Packages Subscribed
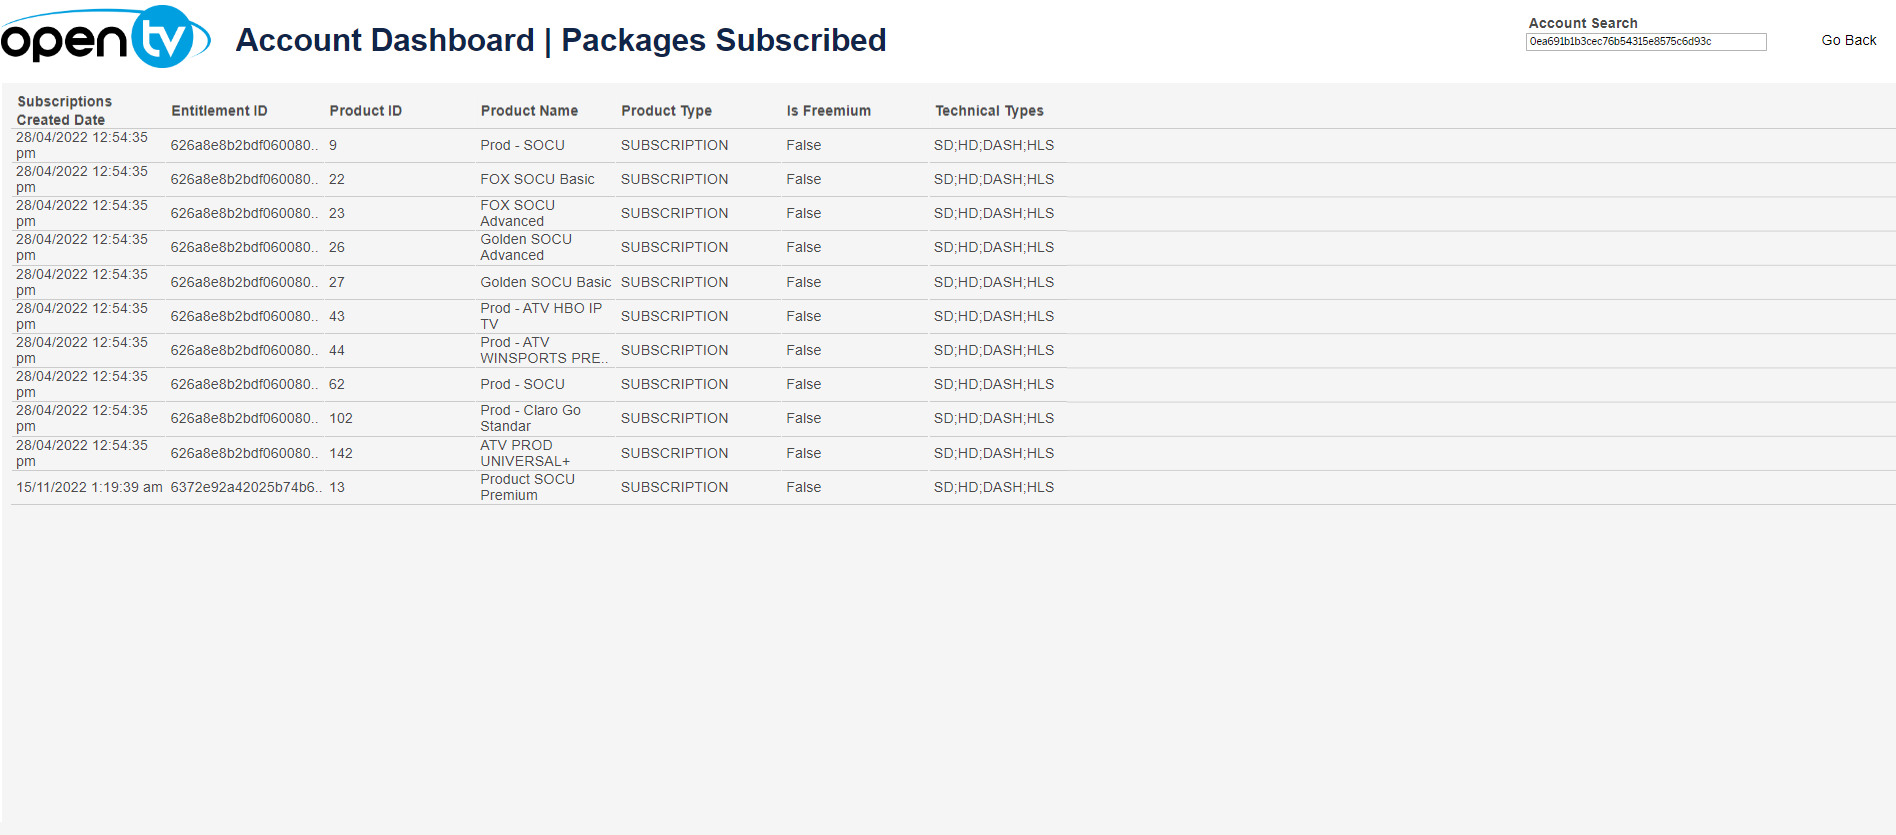
The Packages Subscribed tab shows details of the packages that the selected account is subscribed to, including:
-
Subscription creation date
-
Entitlement ID
-
Product ID
-
Product name
-
Product type
-
Whether the product is a freemium product
-
Technical types
Account Dashboard | Recordings
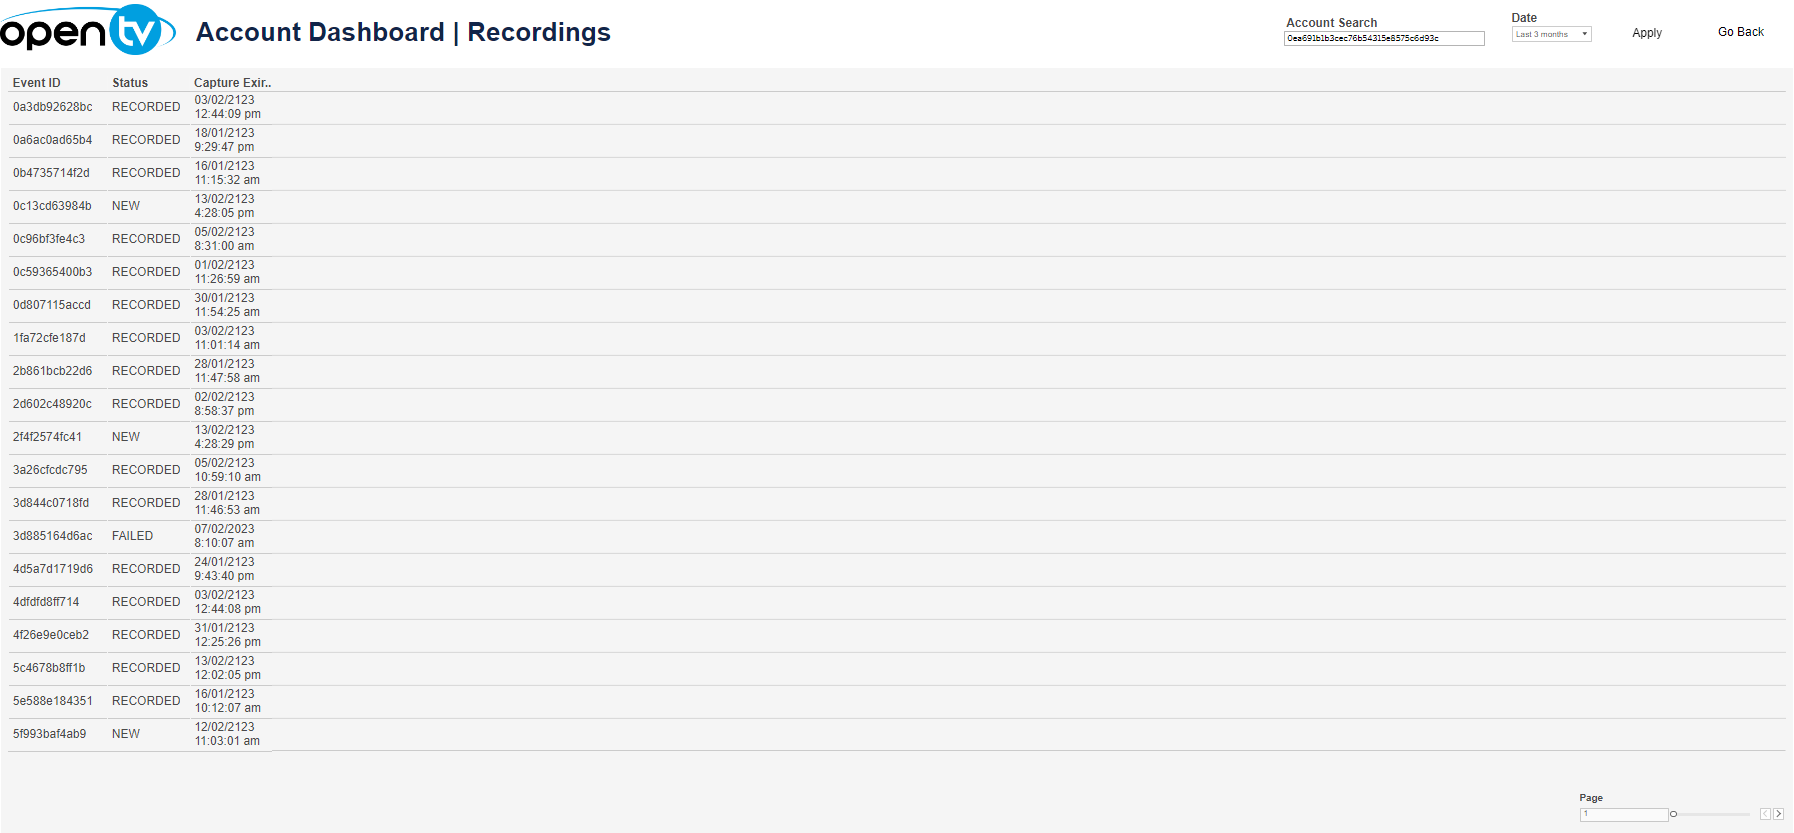
The Recordings tab shows details of recordings for the selected account, including:
-
The event ID
-
The recording status
-
The capture expiration date
At the top of the page, you can:
-
Change the date range
Account Dashboard | Content Views
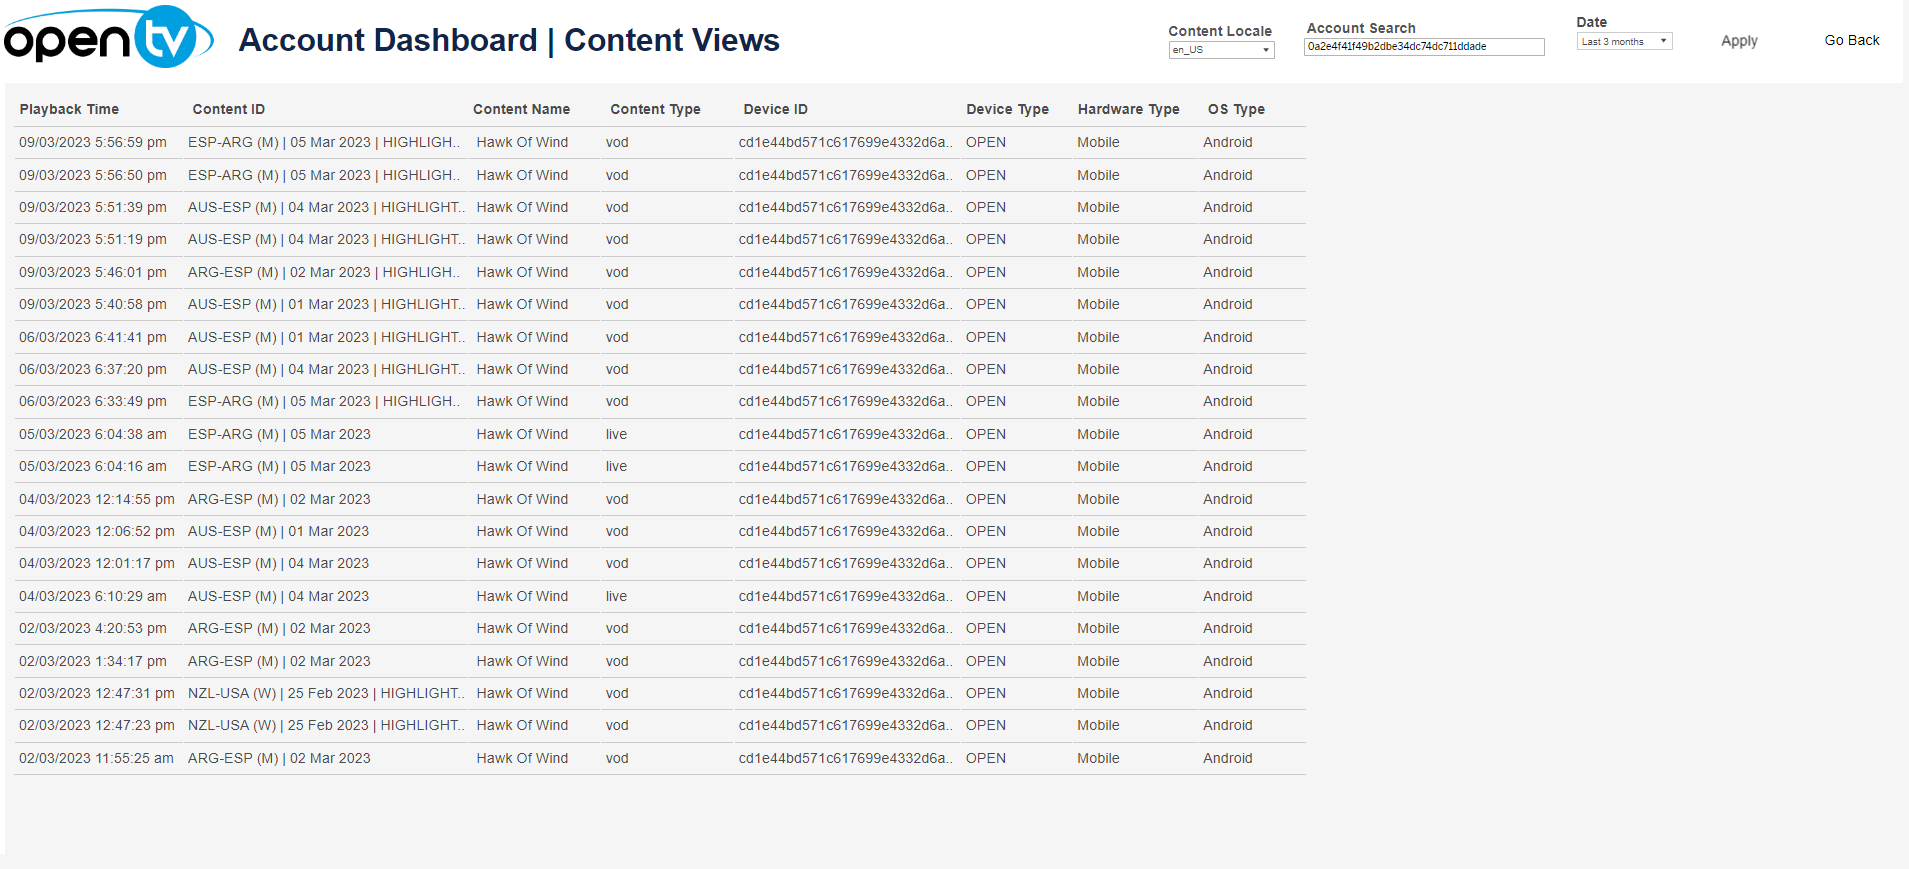
The Content Views tab shows detail about the content viewed by the selected account, including:
-
The time playback started
-
The ID of the content
-
The name of the content
-
The content type
-
The ID of the device used
-
The device type
-
The hardware type
-
The OS type
At the top of the page, you can:
-
Change the date range
-
Filter by content locale
Account Dashboard | Devices
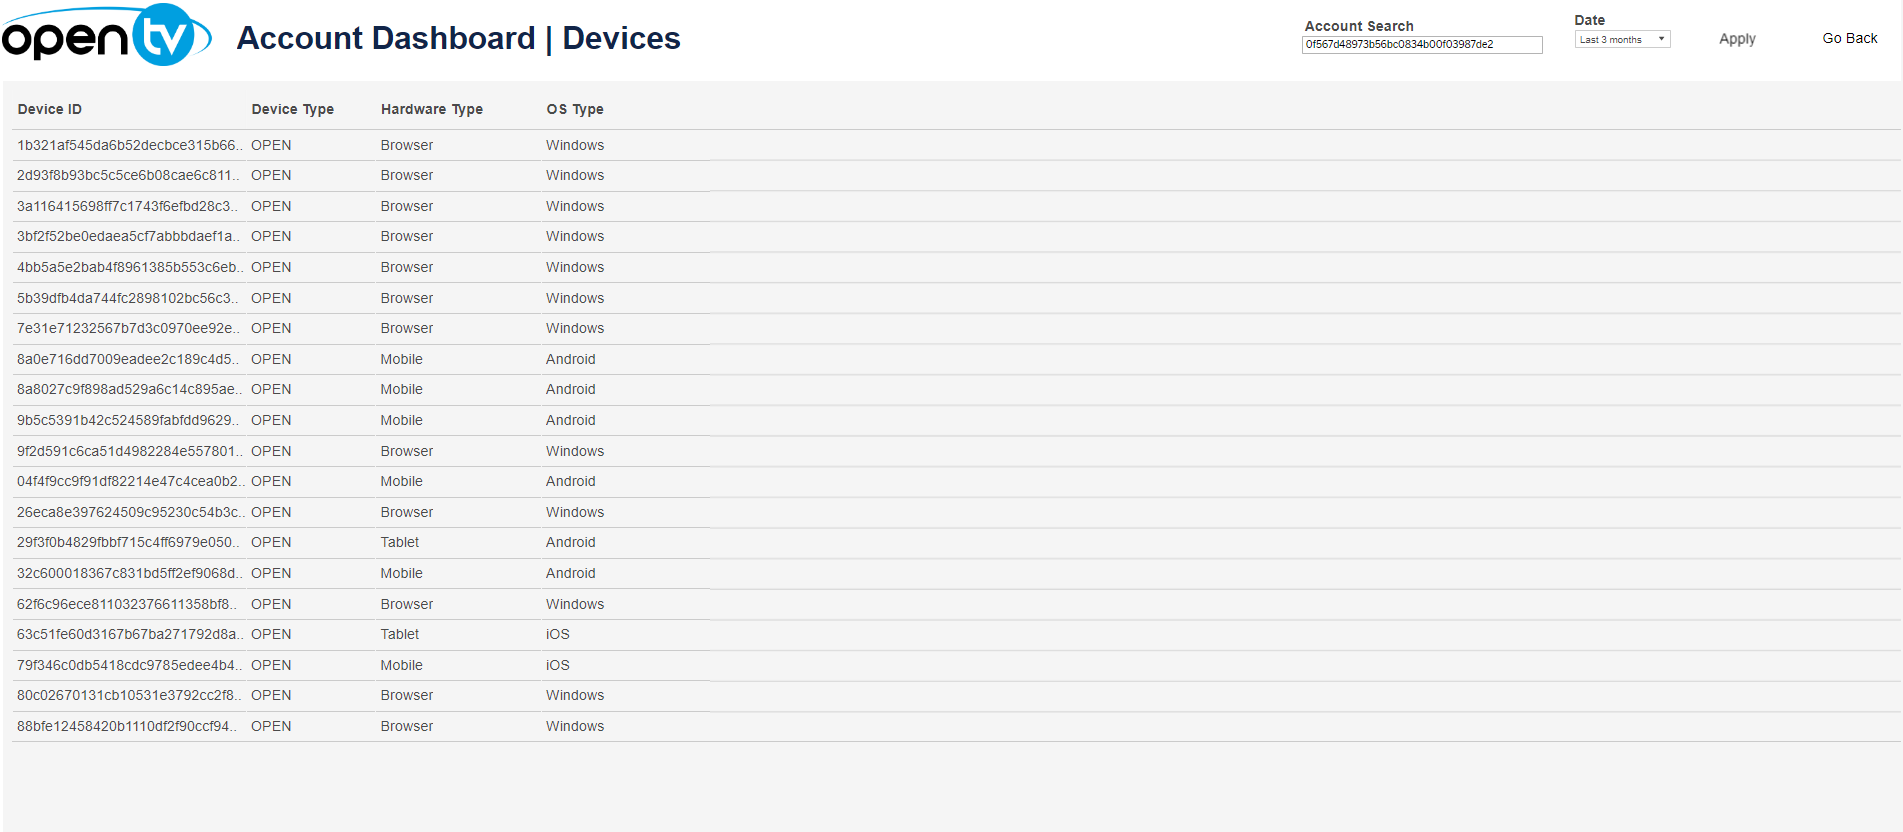
The Devices tab shows details of the devices that are registered to the selected account, including:
-
The device ID
-
The device type (open or managed)
-
The device's hardware type
-
The device's OS type
At the top of the page, you can:
-
Change the date range
Account Dashboard | Recent Activities
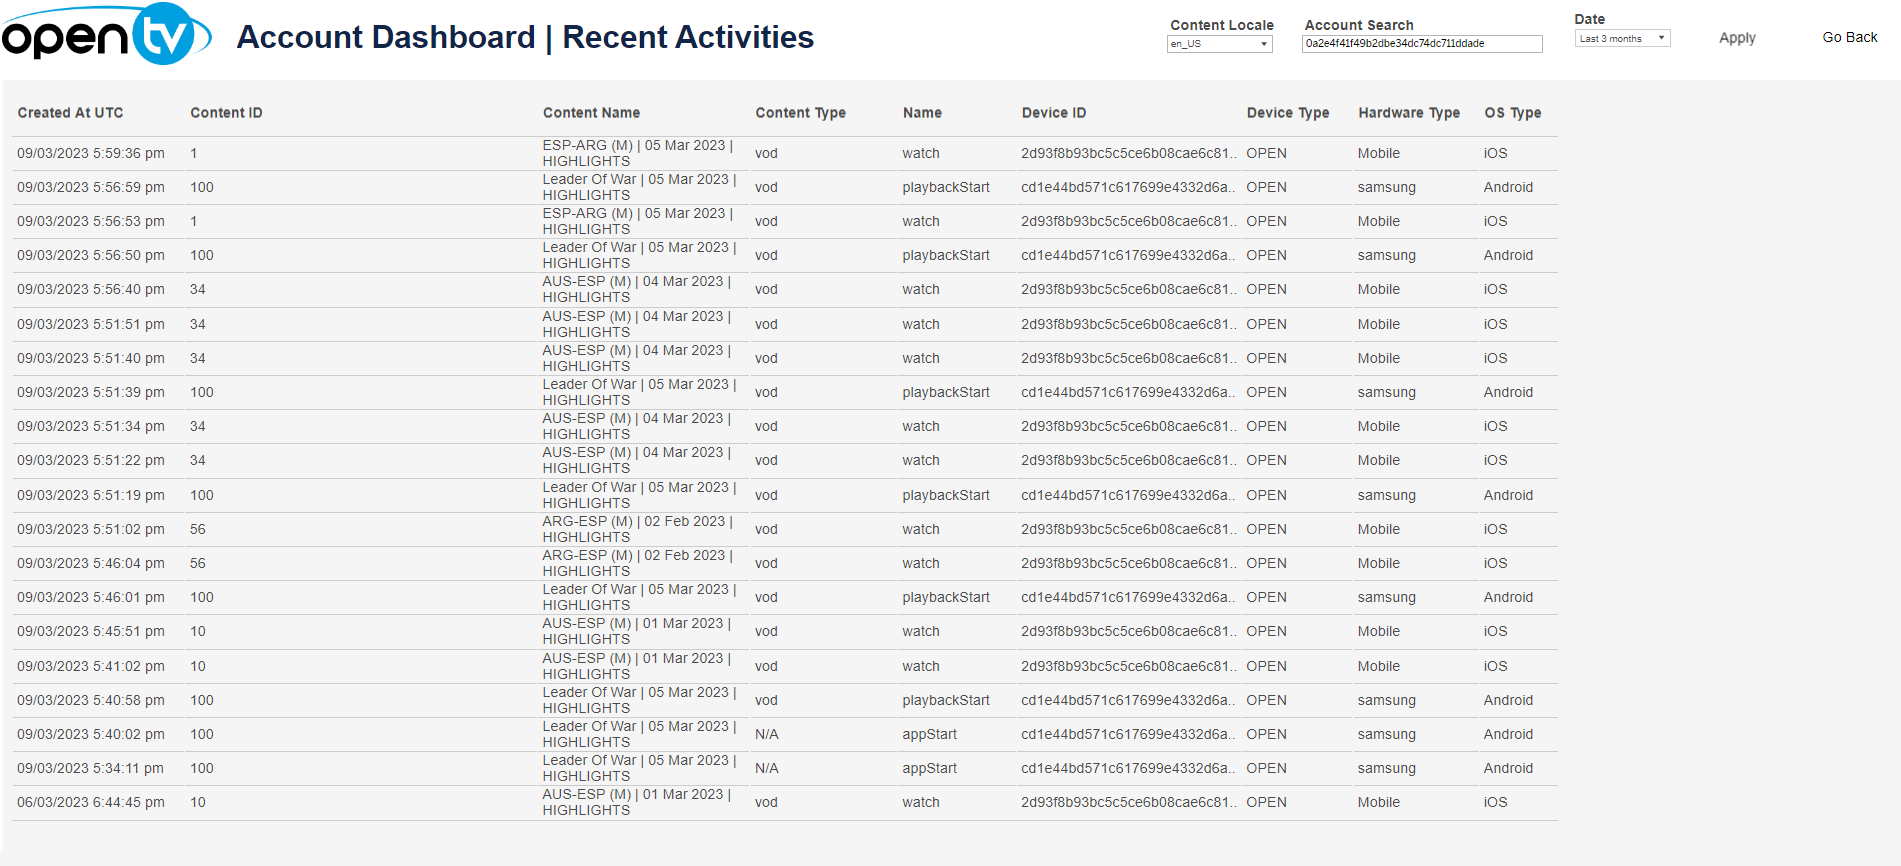
The Recent Activities tab lists recent events for the account, including:
-
The time and date the event was created
-
The ID of the content that the event relates to (if any)
-
The name of the content that the event relates to (if any)
-
The type of the content that the event relates to (if any)
-
The event name
-
The device ID
-
The device type (open or managed)
-
The device's hardware type
-
The device's OS type
At the top of the page, you can:
-
Change the date range
-
Filter by content locale
Account Dashboard | Player Errors
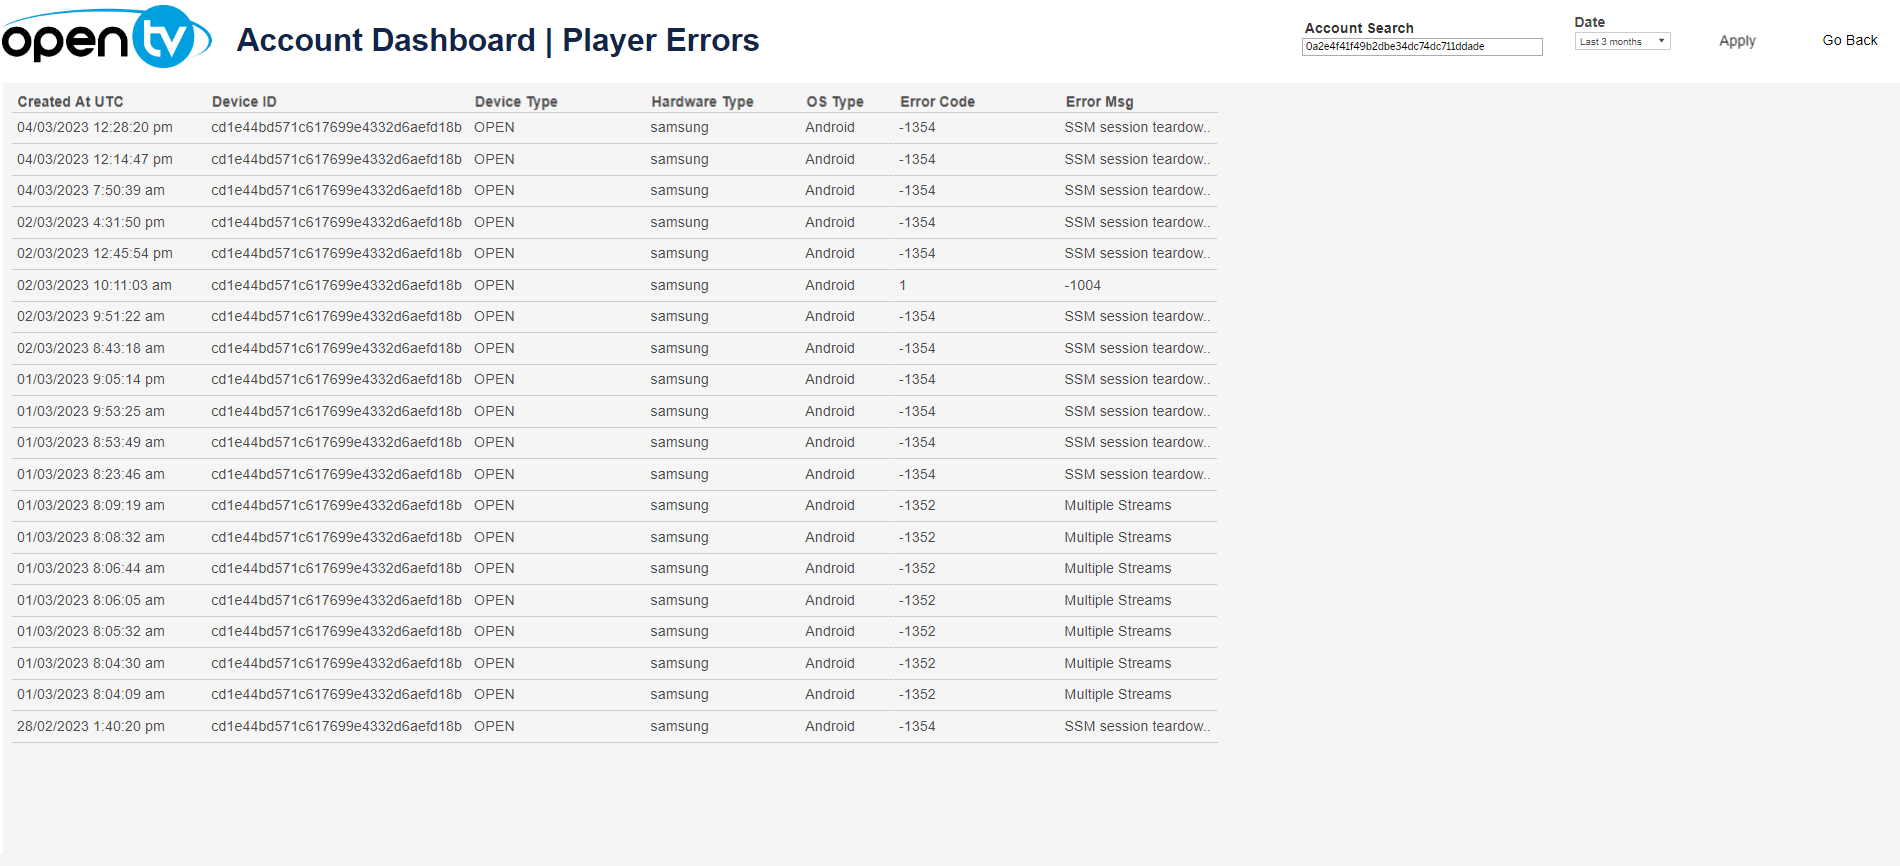
The Player Errors tab lists any player errors that were encountered by the selected account, including:
-
The date and time that the error occurred
-
The ID of the device on which the error occurred
-
The hardware type of the device on which the error occurred
-
The OS type of the device on which the error occurred
-
The error code
-
The error message
At the top of the page, you can:
-
Change the date range