
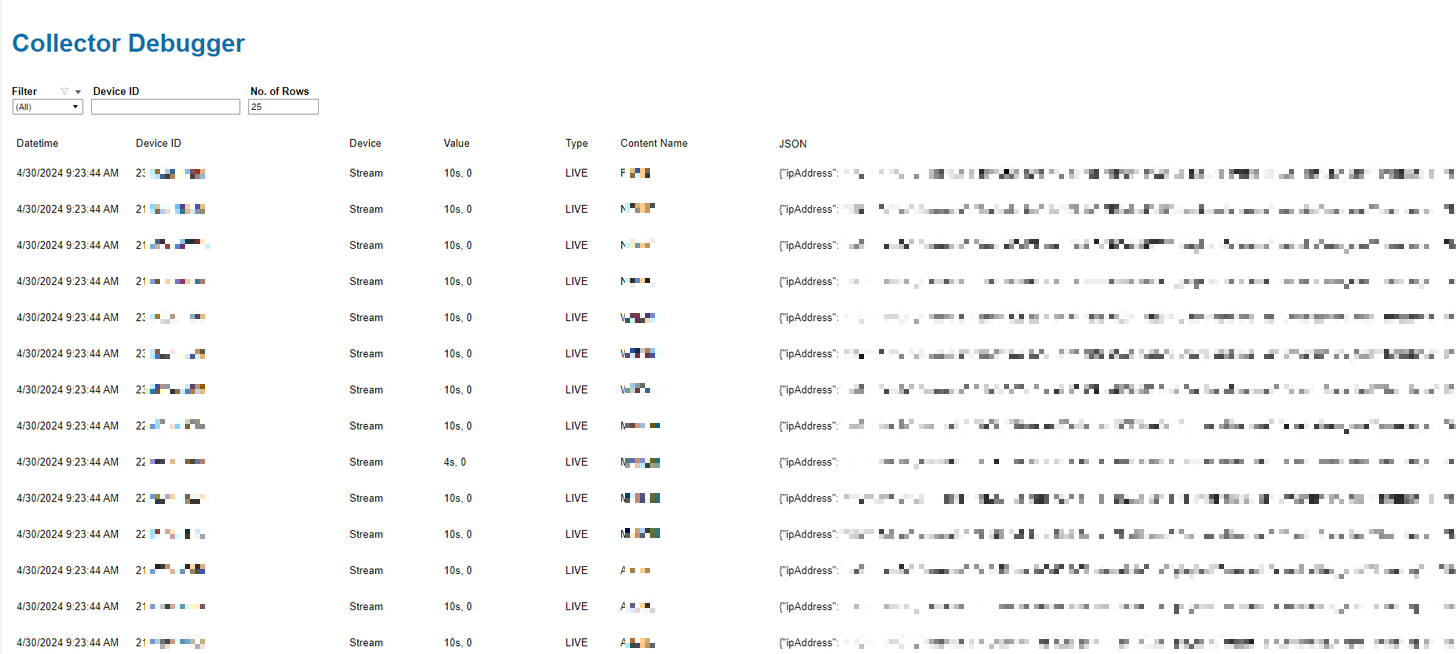
The Collector Debugger table shows the playback metrics and playback events during the last three minutes.
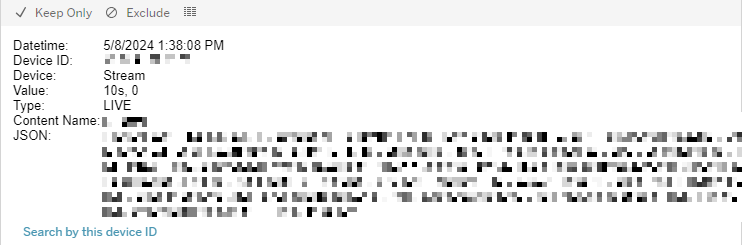
The table shows columns for Date/time, Device ID, Device, Value*, Type, Content Name*, and the corresponding JSON* string.
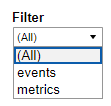
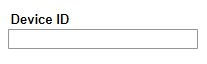
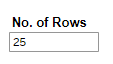
At the top of the page, users can:
-
Filter the data by events/metrics using the drop-down menu.
-
Search by Device ID.
-
Configure the number of rows to display in the table.
Further details for the Value and Content Name columns are given below:
-
Value:
-
When the message is a metric, this column displays the number of seconds viewed and the number of seconds buffering.
-
When it is an event, it displays the event name.
-
-
Content Name – this field displays the channel name:
-
If the channel name is not reported, it displays the event name.
-
If the event name is not reported, it displays the content name.
-
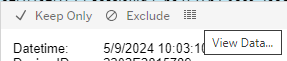
Clicking on any single table entry displays a tooltip. Users can filter the table data by the specific Device ID in the row selected by clicking Search by this device ID.
The mouseover tooltip on the JSON column lists the information shown in each of the seven columns for the row selected.
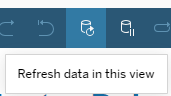
To refresh the table with the latest data, users can click Refresh data in this view from the toolbar icon at the top of the page.
The table data including the JSON string for a particular playback event can also be downloaded by clicking the View Data table icon from the JSON column tooltip.
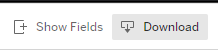
This opens the table data in a new window, from which the data can be downloaded in .csv format by clicking the Download icon at the top-right of the window.
The IP addresses currently shown in the JSON are not valid client IP addresses, but rather proxy IP addresses.