
.png?cb=6668ecdfb8f7d867da2c833b5104a133)
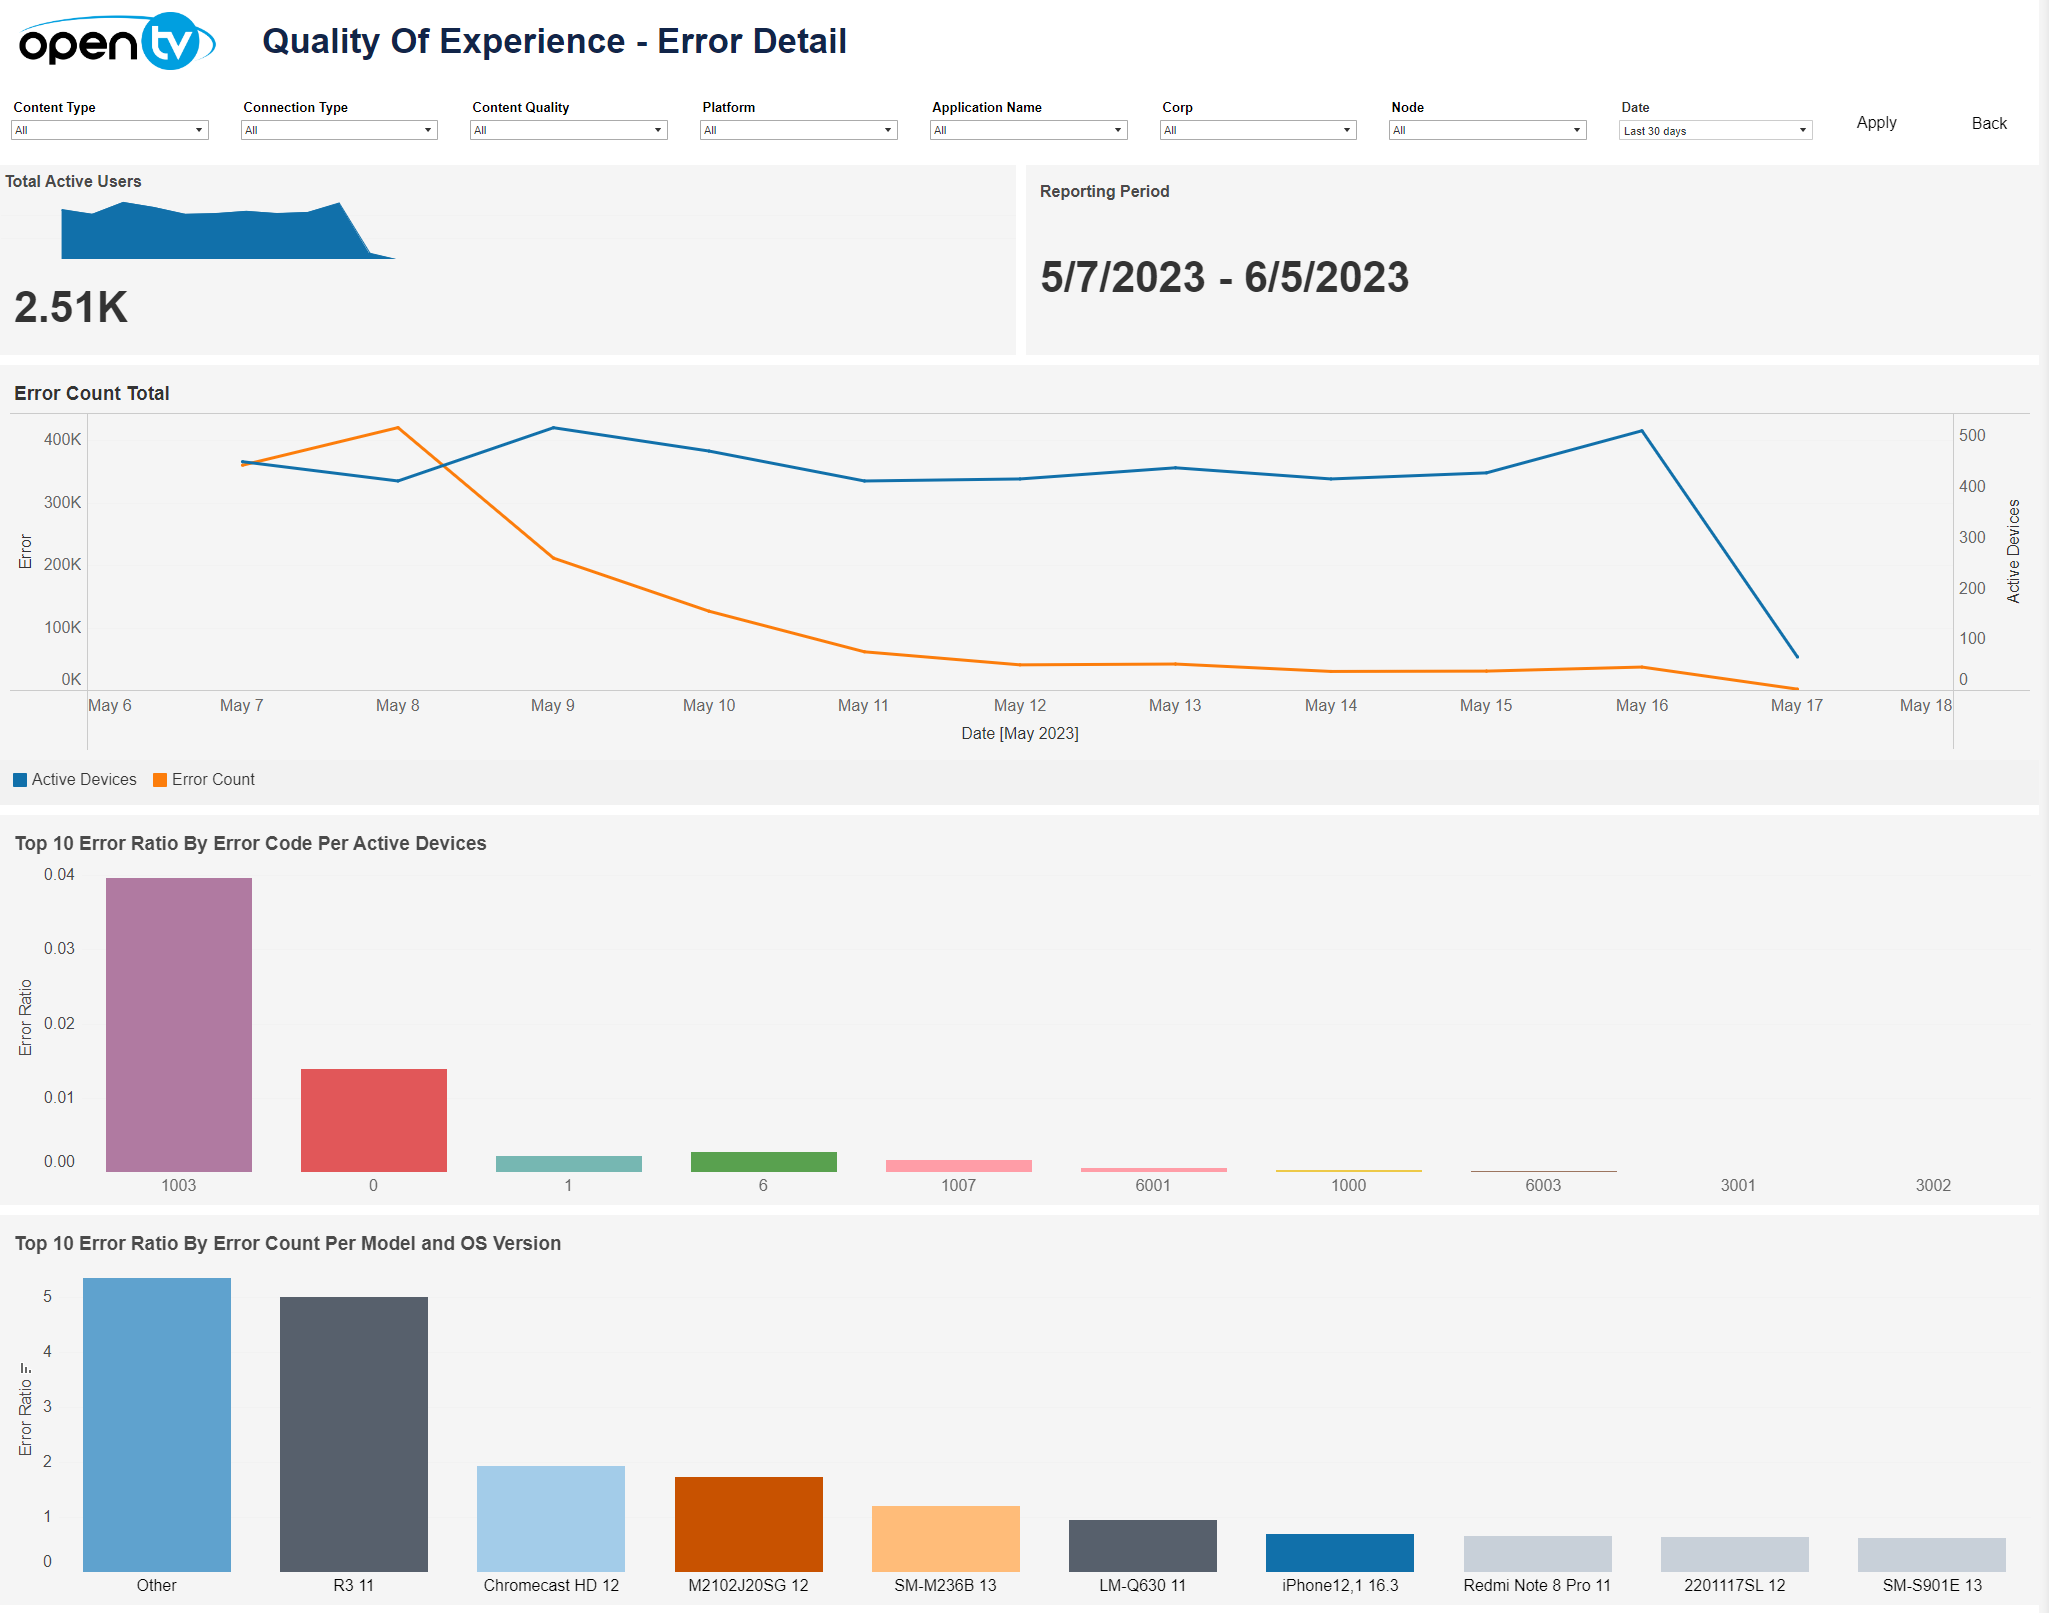
The Error tab lets you see a variety of error-related data for the selected time period and filters, including:
-
Total active users per day
-
Error count total – line chart shown the error count per day
-
Top 10 error ratio by error code per active device – bar chart presenting the top 10 error ratio by error code per active device
-
Top 10 error ratio by error count per model and OS version – bar chart presenting the top 10 error ratio by error count per model and OS version
-
Error detail:
-
Table listing error count by account with device details
-
Select the account to filter the error statistics and error code detail by account.
-
-
Error statistics:
-
Table listing error count and number of devices impacted by error code with error and device details
-
Select the error to filter the error code detail by error code.
-
-
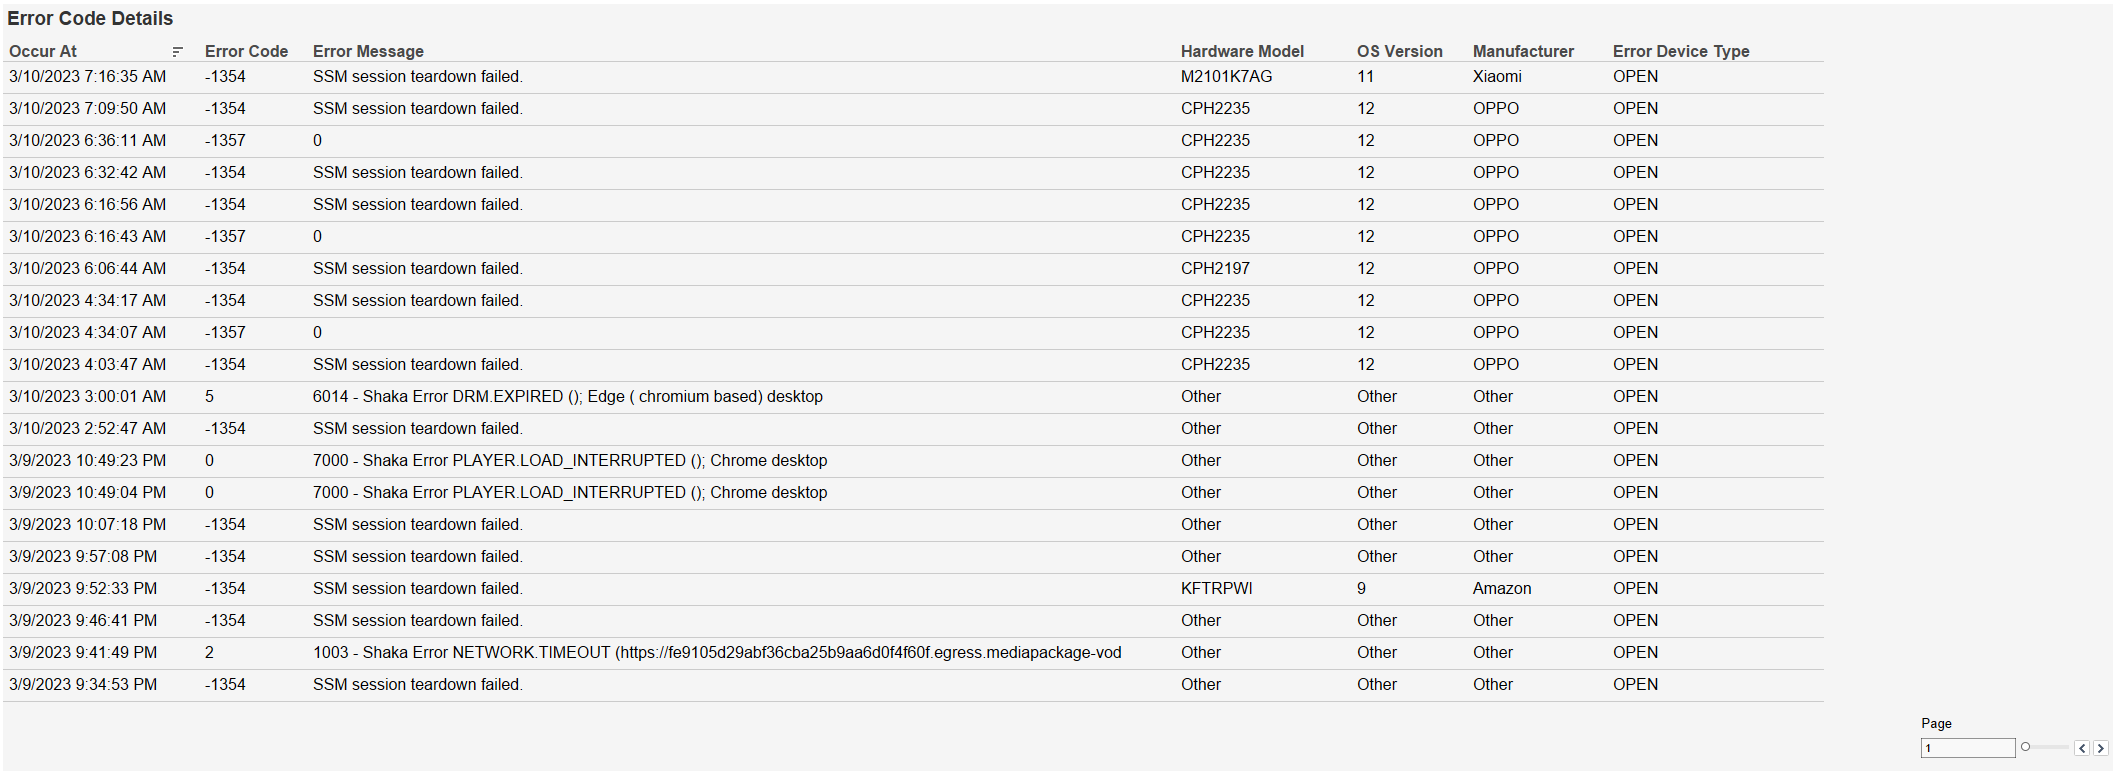
Error code detail – table listing error occurrences with error code and device details
At the top of the page, you can:
-
Change the date range.
-
Filter using the dropdowns.
Only the Content Type and Platform filters are available in the current release.
In each tile, you can:
-
Hover over or click the data or chart to see additional information.
-
Click and continue hovering over the tile, then click

In this window, you can:-
See more detailed data, including (for some categories) a list of the accounts that comprise the total shown in the tile.
-
Change the sort order.
-
Show and hide fields.
-
Change the number of rows displayed.
-
Download the data.
-