
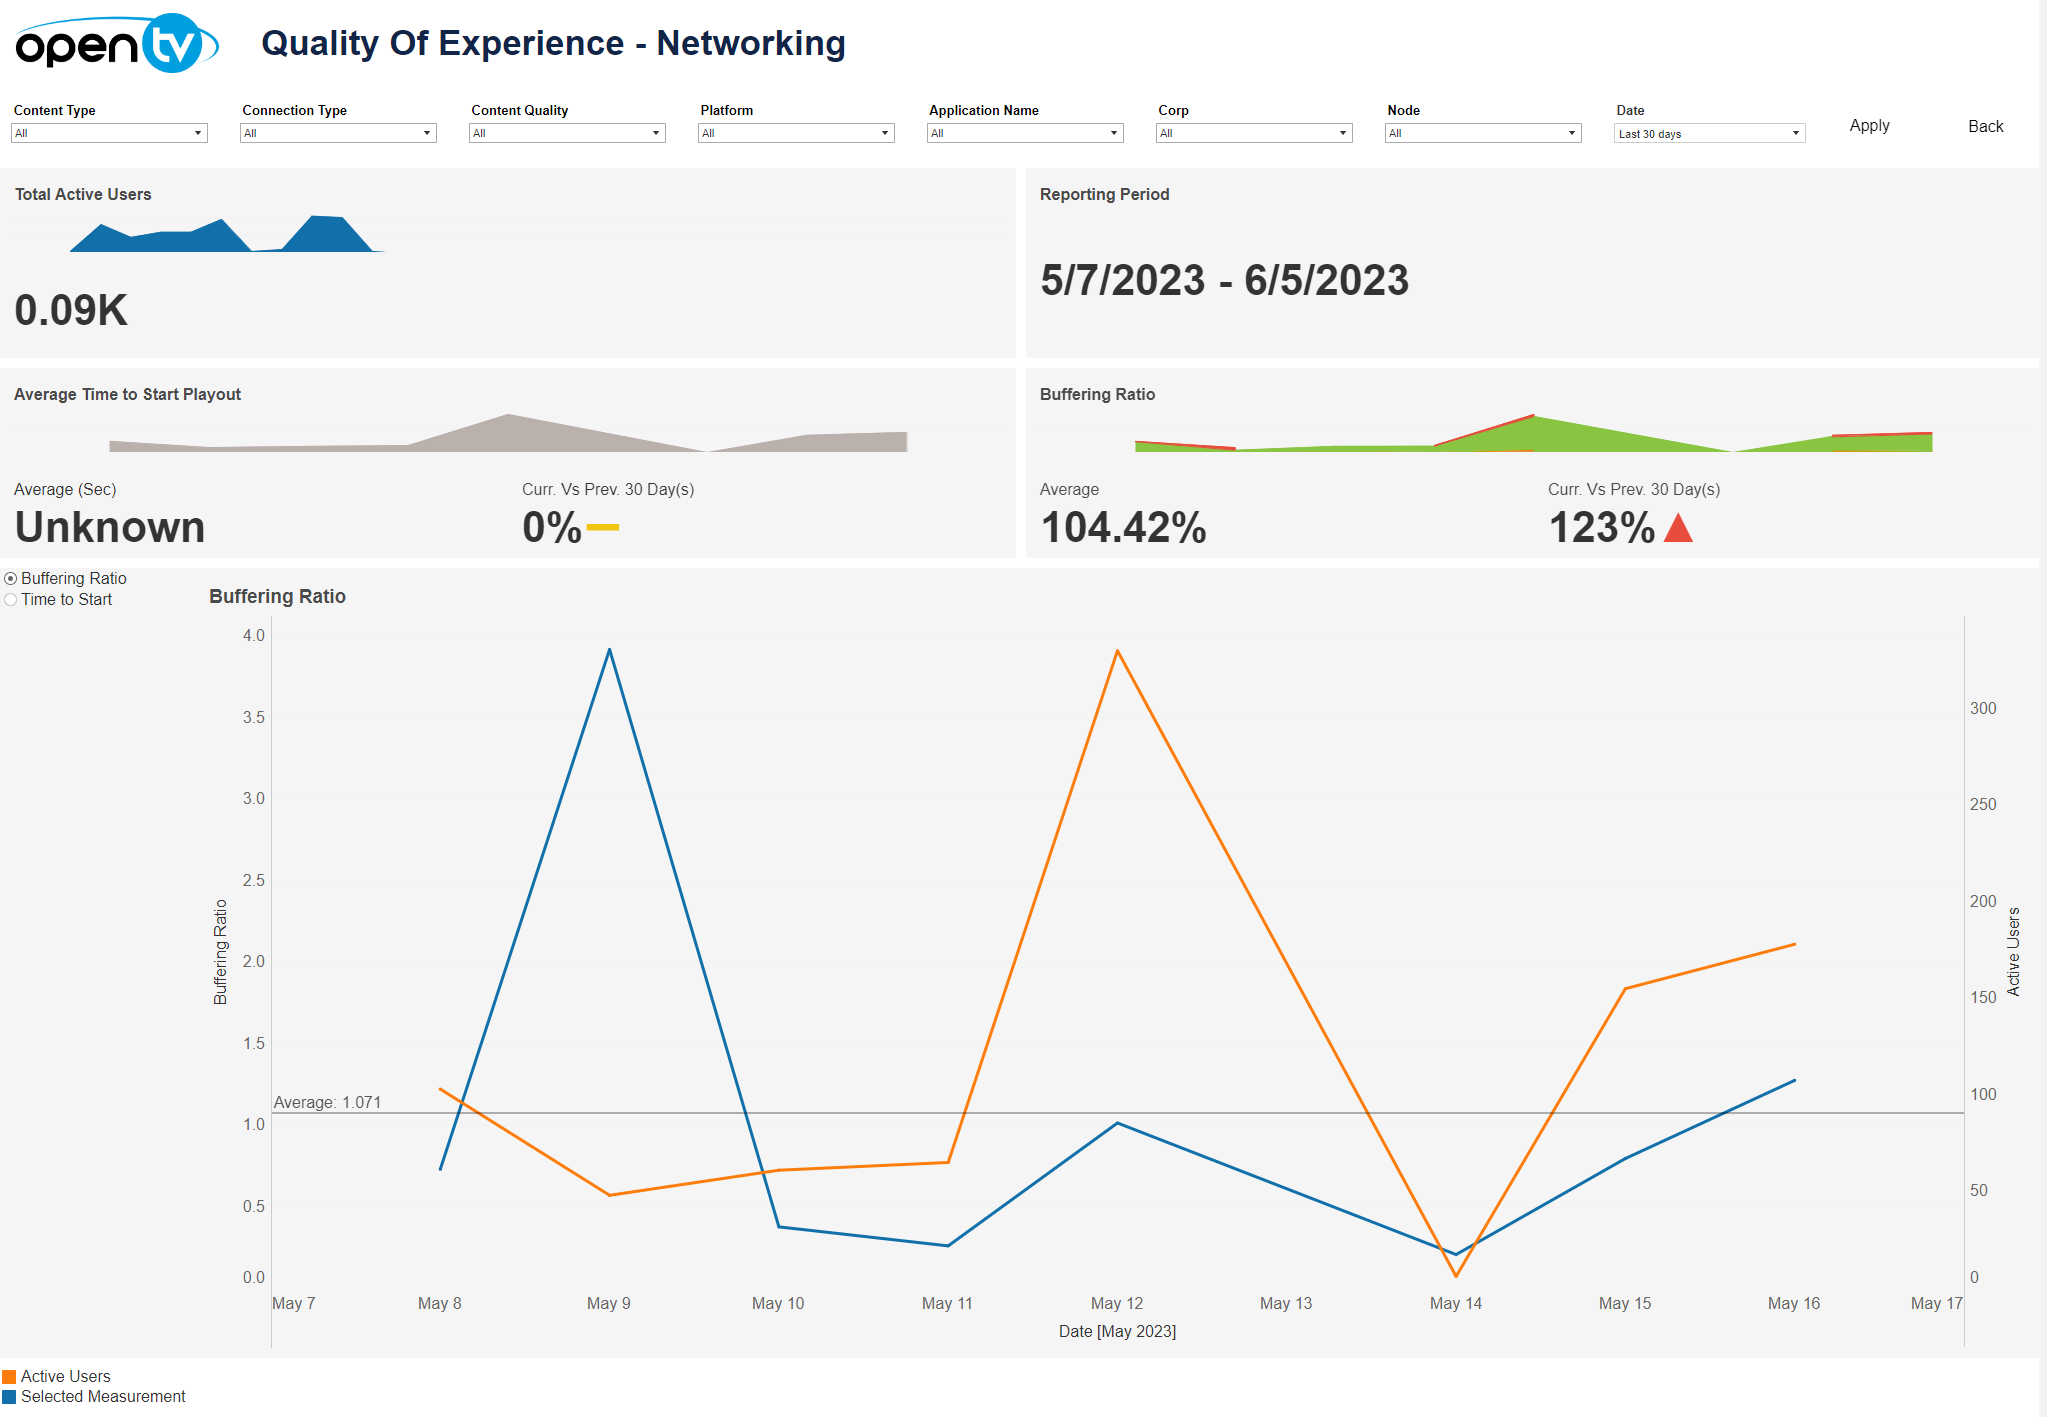
The Networking tab lets you see a variety of networking related data for the selected time period and filters, including:
-
Total active users per day
-
Average buffering rate ratio per day:Average buffering rate for the selected date rangeComparison of the average buffering rate versus the previous date range
-
Average time to start playout per day:Average time to start playout for the selected date rangeComparison of the average time to start playout versus the previous date range
-
Average buffering ratio per day:Average buffering ratio for the selected date rangeComparison of the average buffering ratio versus the previous date range
-
Line chart:Select the KPI using the radio button.The line chart will show the count of the selected measurement per day.
At the top of the page, you can:
-
Change the date range.
-
Filter using the dropdowns.
Only the Content Type and Platform filters are available in the current release.
In each tile, you can:
-
Hover over or click the data or chart to see additional information.
-
Click and continue hovering over the tile, then click

In this window, you can:See more detailed data, including (for some categories) a list of the accounts that comprise the total shown in the tile.Change the sort order.Show and hide fields.Change the number of rows displayed.Download the data.