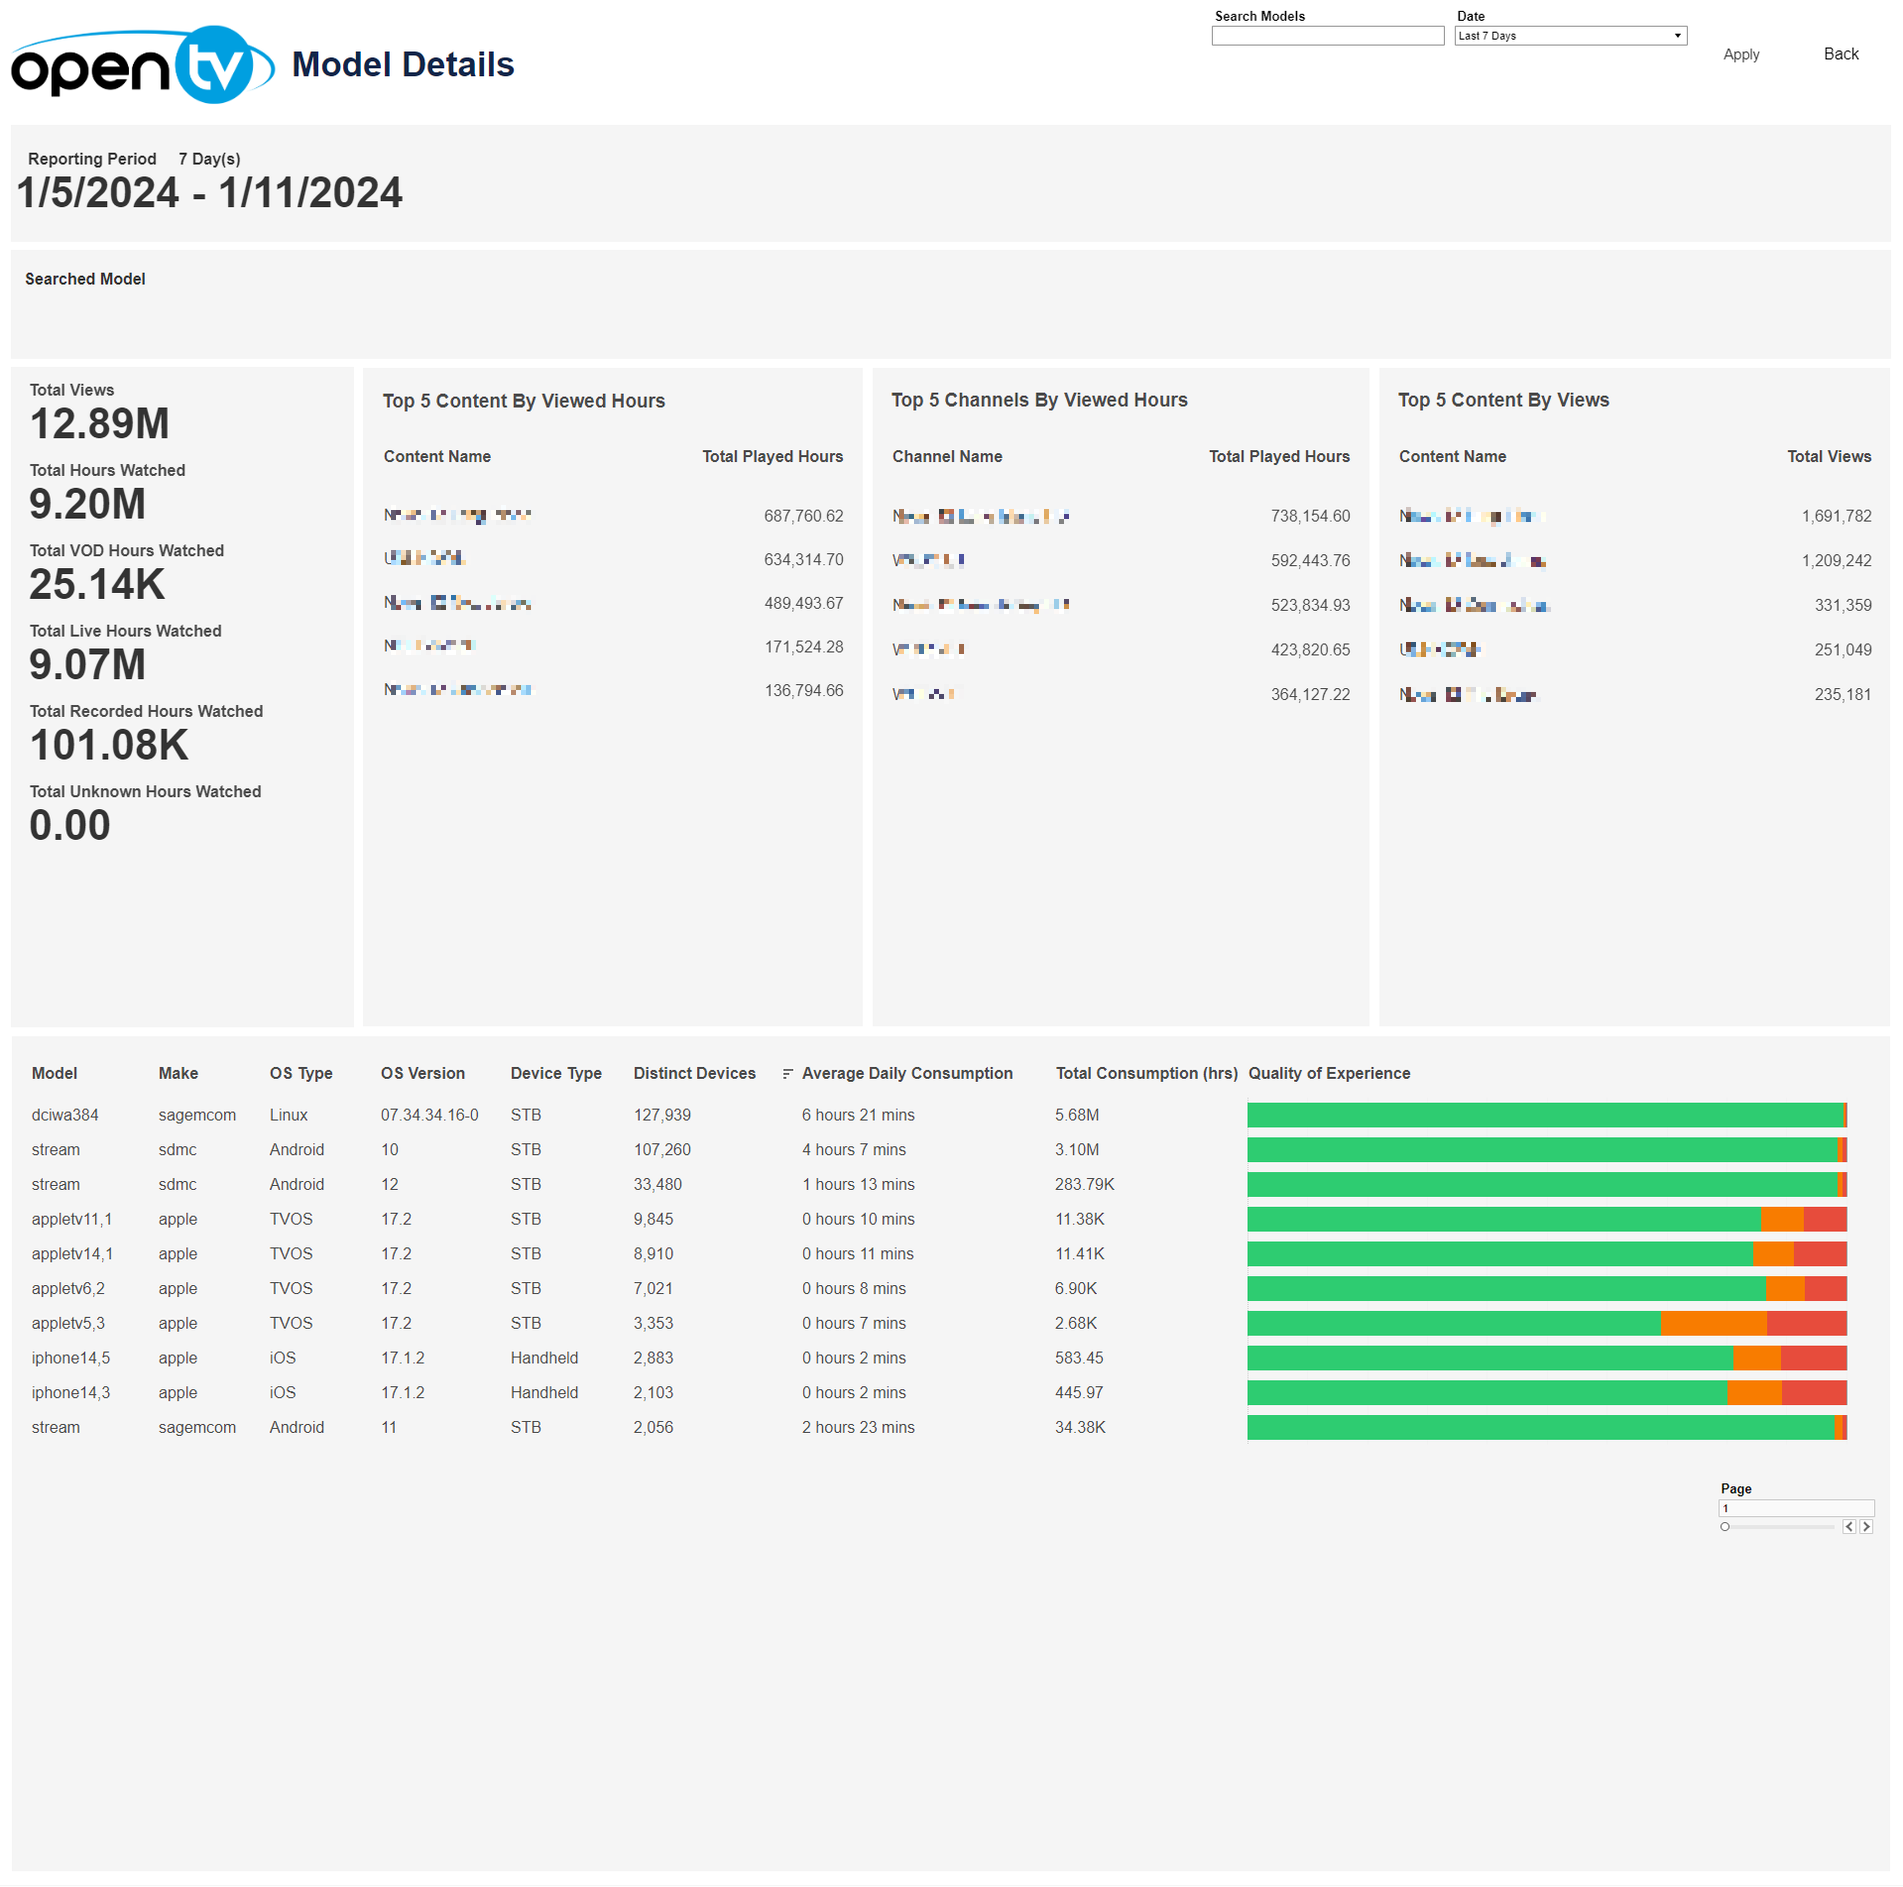
This page shows Model Details for the available OS Types. It displays total viewing figures for VOD, Live, and Recorded hours, and Top 5 tables for Content By Viewed Hours, Channels By Viewed Hours, and Content By Views.
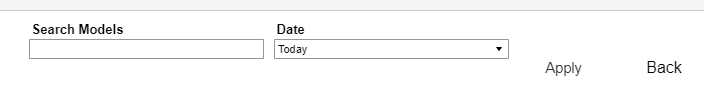
Model Search and Date select
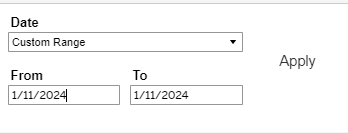
The top right of the page shows a Search Models bar and a Date drop-down menu, with preset time intervals for Today, Yesterday, Last 7 days, Last 14 days, and Last 30 days. Selecting one of these options then clicking Apply loads the data.
Users can also select Custom Range, which causes the From and To date fields to appear below, and allows users to specify any time interval (provided dates are not in the future). Users must then click Apply to load the data.
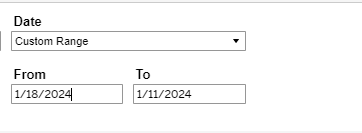
Selecting a From date that lies in the future causes the Apply button to disappear:
A Back button is also shown at the top right of this page. Clicking it returns the user to the Overview page.

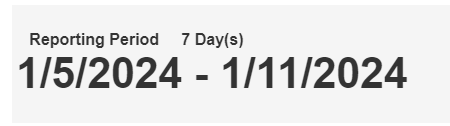
Below, the report shows the selected Reporting Period day count and specific dates chosen.
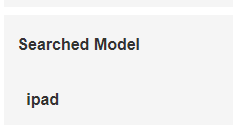
Searched Model Selection
Below Reporting Period, the report shows which model that has been searched for has been selected from the Search Models box. If no search is performed, the field remains empty.
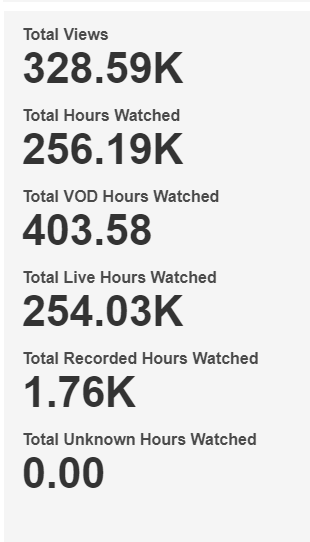
Total Views
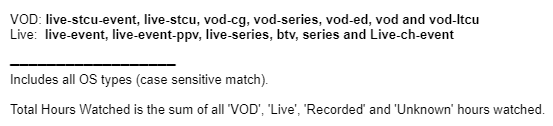
Below the selected filter list, the report shows overall view figures by category. A mouseover tooltip gives further details and definitions.
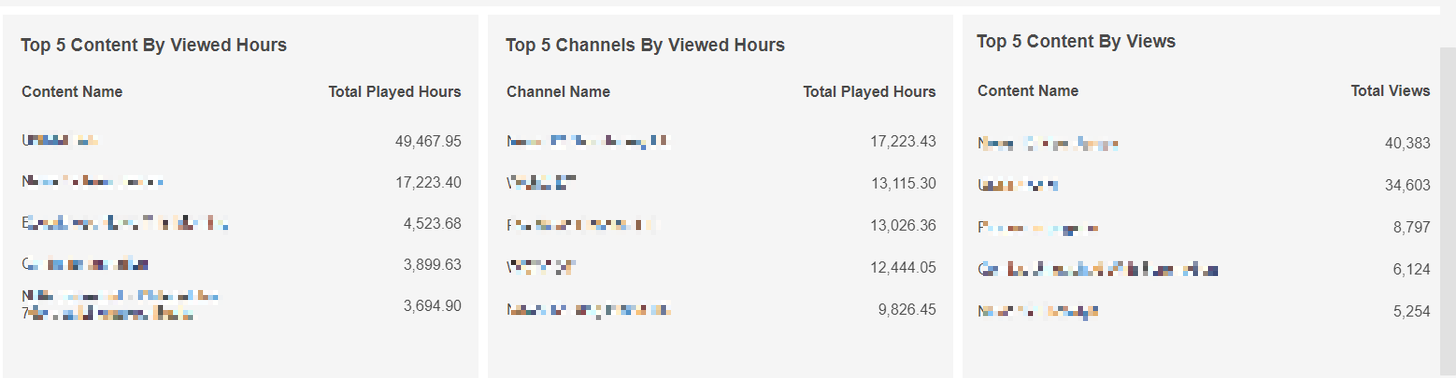
Top 5 Content
The report then shows Top 5 Content by Viewed Hours, Top 5 Channels By Viewed Hours, and Top 5 Content By Views.
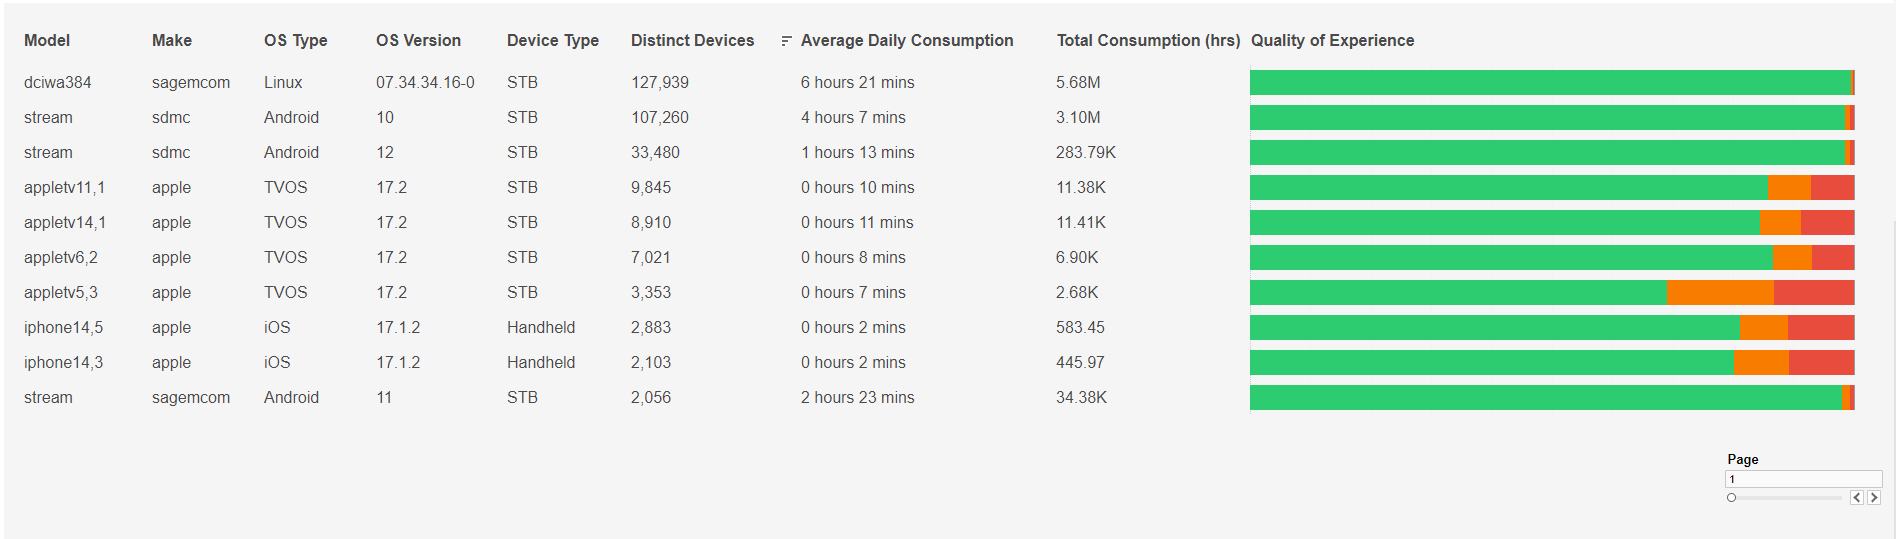
Model Details Table
Finally, the report shows a table for Model Details, with columns for Model, Make, OS Type, OS Version, Device Type, Distinct Devices, Average Daily Consumption, Total Consumption, and QoE.
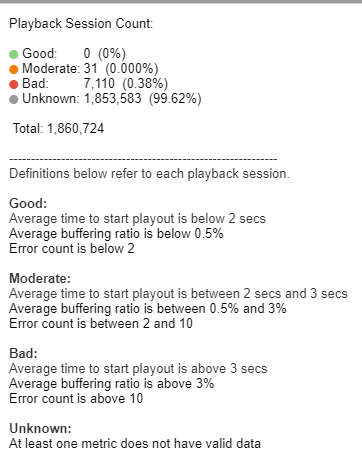
The table is sorted by Distinct Device count. Individual rows can be highlighted by single-clicking. A mouseover tooltip gives further information and definitions for QoE.
Users can navigate between pages by clicking the page select button at the bottom right.